

HUGE INSIGHTS: The Big Picture - Issue #39
The Law of Gravity

Please enjoy the free portion of this monthly newsletter with our compliments. To get full access, you may want to consider an upgrade to paid for as little as $12.50/month. As an added bonus, paid subscribers also receive our weekly ALPHA INSIGHTS: Idea Generator Lab publication, which provides updated market analysis and details our top actionable trade idea very Wednesday, as well as other perks, including periodic ALPHA INSIGHTS: Interim Bulletin reports and exclusive video content.
Executive Summary
Philosophiae Naturalis Principia Mathematica
Macro Overview: It’s a Mad, Mad World
Election Inspection: Democracy’s Discontent
Market Analysis & Outlook: Reversal of Fortune
Conclusions & Positioning: Ode to Satoshi
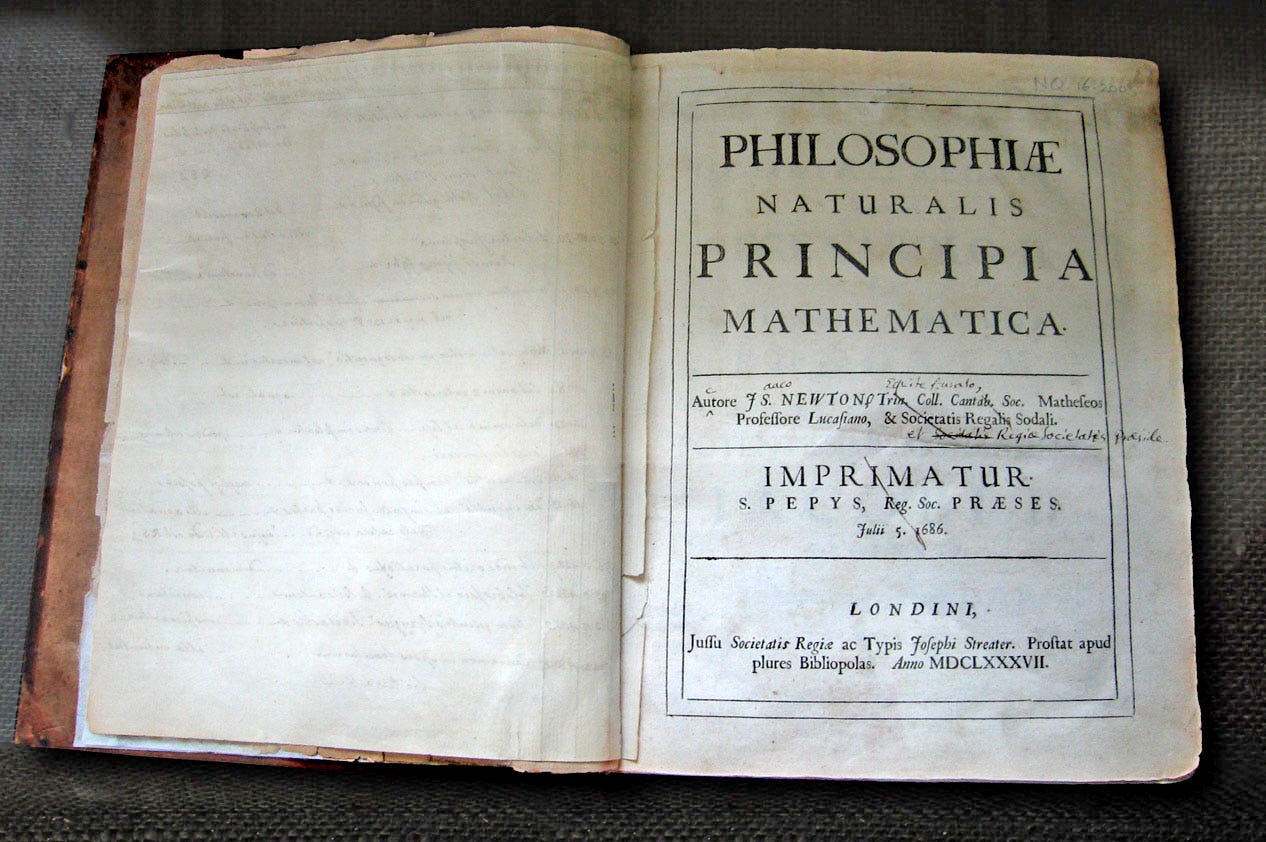
Philosophiae Naturalis Principia Mathematica
Sir Isaac Newton was a 17th century English polymath known for his contributions to mathematics, physics, astronomy, and theology. He was also a member of Parliament in 1689 and 1701, and became the warden of the British Royal Mint in 1696 — a position he held until his death in 1727. Newton is probably best known for his work in celestial mechanics and for his law of universal gravitation, which is detailed in his magnum opus, Philosophiae Naturalis Principia Mathematica (Principia), and further aggrandized by the legend that Newton took his inspiration for the discovery from a falling apple, which purportedly struck him on the head while sitting under an apple tree.
A lesser known fact is that Newton was obsessed with the pseudo-science of alchemy, an ancient forerunner to the branch of science now known as chemistry. One of the goals of alchemy was the transmutation of base metals into gold. Coincidentally, Newton had an important hand in moving Britain from the silver standard to the gold standard. His 1717 recommendation to the Lords Commissioners of His Majesty’s Treasury that the bimetallic exchange rate between gold and silver coins be changed to 1 gold guinea for 21 silver shillings resulted in a silver shortage — effectively moving Britain to the gold standard. It is a matter of debate among scholars as to whether or not Newton intended this consequence. Some have argued that Newton conceived of the idea as a practical solution to his failed alchemical work.
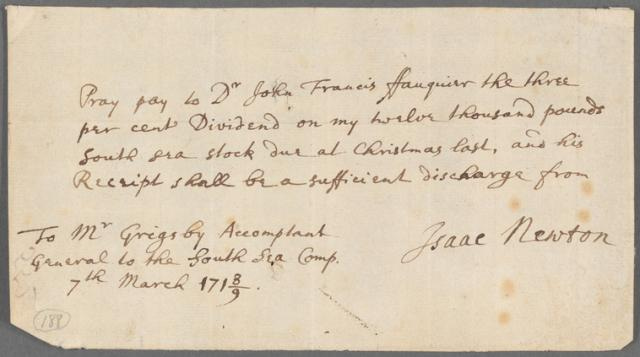
Another little known fact about Newton was that he was a rather astute investor. In 1931, Richard de Villamil used the inventory documents related to Newton’s estate, which he located in court archives, together with other published information that was then available, to suggest that Newton left his heirs a proverbial fortune. Villamil’s conclusions were later validated by a separate study on the subject completed by John Maynard Keynes, which was published posthumously in 1963. Keynes’ assessment also showed that Newton died a rich man. But it was the work of Richard S. Westfall, who in 1980, published what is widely regarded as the most authoritative biography on the life and work of Sir Isaac Newton, that casts some doubt upon the preceding deduction. Therein, Westfall documented a rather inauspicious claim with respect to Newton’s investment prowess — that in March 1719, Newton was induced to invest a substantial sum into a then popular company, whose stated purpose was “carrying on an undertaking of great advantage.”
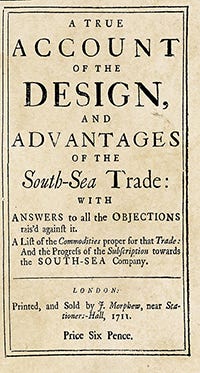
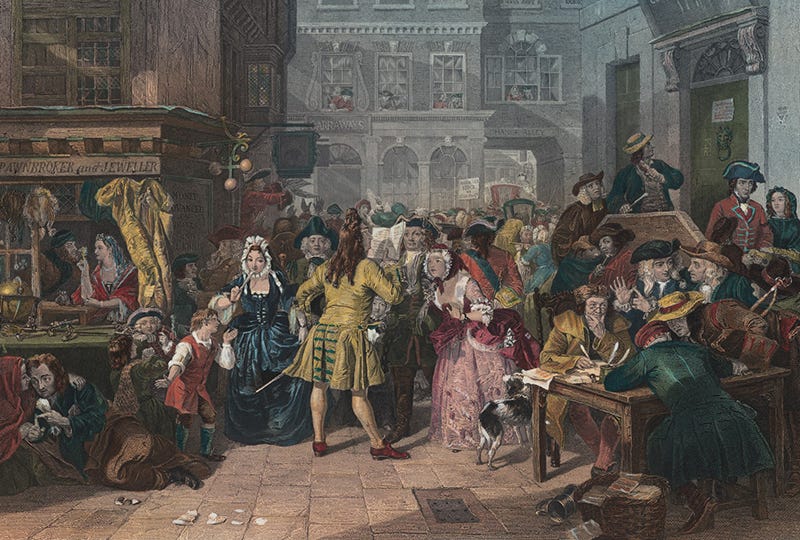
The South Sea Company was born in 1711 as the inspiration of Robert Harley — the Earl of Oxford, who was joined by a scrivener named John Blunt, who by profession was accomplished in the copying of legal documents and no less so in the learning from their contents. It’s origins — by design — were to provide a seeming and welcome solution to the distressing problem of the government debt that had been incurred by Great Britain in previous years during the War of the Spanish Succession. In return for its charter, the South Sea Company took over and consolidated an assortment of British government debts. It was paid interest by the government at the rate of 6% and received the right to issue stock and to have “the sole trade and traffick, from 1 August 1711, into unto and from the Kingdoms, Lands, etc. of America, on the east side from the river Aranoca, to the southernmost part of Terra del Fuego…” Added was all trade on the western side of the Americas and “into unto and from all countries in the same limits, reputed to belong to the Crown of Spain, or which shall hereafter be discovered.”
Overlooked was the fact that Spain claimed a monopoly over the truck and trade within this great region, although there was some distant hope that treaty negotiations then underway would accord Britain access to the fabled metallic wealth of Mexico, Peru, and the rest. In the end, a small window of opportunity did open. Spain briefly allowed the company one voyage a year, subject to a share of its profits. Hope for something better was then partly sustained by the notion that sovereignty over Gibraltar might be traded for greater access to the Americas. Unfortunately, for the South Sea Company and its shareholders, the question of that sovereignty was to remain in contention between Britain and Spain for another two and a half centuries.
In fact, it would be hard to imagine a commercial enterprise that was more questionable than the South Sea Company. But, as it happens, it was not a time for questions. Further issues of stock for the further assumption of government debt were authorized and offered to the public. Early in 1720, the whole public debt of Great Britain was assumed. So great were the presumed advantages of the enterprise that the legislation was facilitated by the endowment of gifts of South Sea stock to key ministers of the government, as several directors of the company who also sat in Parliament made known therein the many great prospects awaiting the company. Of course, said directors were also generous in awarding stock to themselves.
Later that same year, the British public responded vigorously to the professed opportunity presented by the South Sea Company, or perhaps more likely to the upward thrust of the company’s stock price and the desire to take part in the gains. South Sea stock had enriched a small but significant sector of the British population. The landed and aristocratic classes, though contemptuous of those concerned with making money, were also able to surmount their pride and come aboard — money often has that effect. Decades before the advent of the London Stock Exchange, shares of the company’s stock were being traded in places throughout the city from Jonathan’s Coffee House to Sweeting’s Ally with intense, if not riotous participation by the public. South Sea stock, which had been trading at around £128 in January 1720, went to £330 in March, £550 in May, £890 in June, and to nearly £1,000 by July. Never before in Britain, and perhaps even Holland circa 1636 at the peak of the tulip bulb mania, had so many, become so rich, so suddenly.
Moreover, the South Sea Company was not the only speculative opportunity of its day. Its success spawned at least a hundred imitators, all hoping to take part in the boom. By late-July 1720, the government finally called for a halt; legislation — the Bubble Act — was passed prohibiting these other promotions, giving the South Sea Company a virtual monopoly on speculation — for a time. However, the company’s end was already in sight. The stock went into a tailspin, partly the result of profit-taking by those on the inside and at the top. By September, the stock had fallen to £175, by December to £124. Heroic efforts — rhetorical and otherwise, were made to sustain and revive confidence in the company, including an appeal for help from the newly formed Bank of England. Eventually, with some support from the government, the share price leveled off at £140, an 86% decline from its peak value.
There soon followed a search for scapegoats; Sir John Blunt narrowly escaped death when a presumed victim sought to shoot him down in a London street. He later saved himself by turning in his fellow conspirators — those that held high places. All individuals associated with the company were expelled from Parliament, while officers and directors (including Blunt) had their money and estates confiscated to provide some compensation for the victims. As in the aftermath of the tulip bulb mania in Holland, the economic life of the city of London, and that of the country as a whole remained notably depressed for nearly a generation.
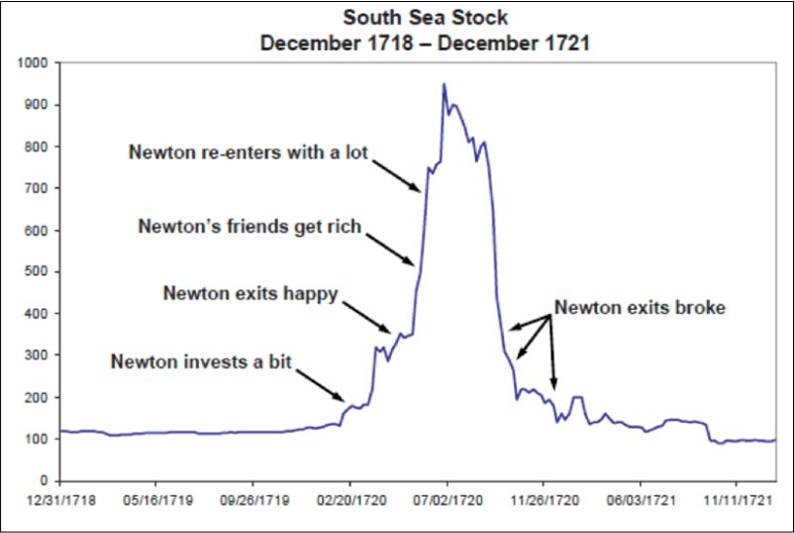
As intimated above, Sir Isaac Newton was an early investors in the South Sea Company. Upon selling his shares at a handsome profit after he became convinced that the stock price had reached a level that was no longer justified, Newton became vocally annoyed as the stock continued to advance to illogical heights over the subsequent weeks. It was reported by John Robartes — the Earl of Radnor that when Newton was asked about the continuance of the rising of South Sea stock, he bluntly answered,
“I can calculate the movement of the stars, but not the madness of men.”
According to some accounts, it is believed that after doubling his money, Newton succumbed to the emotion of FOMO and bought back in at much higher prices after witnessing the stock’s parabolic rise. A 2017 Business Insider article by Elena Holodny quotes numerous past articles that state Newton booked a £20,000 loss (the equivalent of about $5.7 million today) — eventually selling all of his stock after the bubble burst. Yet, Richard Westfall’s research points to records that show Newton still owned approximately £22,000 worth of South Sea stock in 1722. Whether Newton just held his position, or sold and bought back later is not known for certain. What is known is that Newton failed to apply his own axiom to the situation:
“What goes up must come down.”
The entire experience, now known as the South Sea Bubble, had a set of circumstances surrounding it that can best be described as formulaic when considered within the context of the many speculative bubbles that have subsequently inflated and deflated across the centuries to present day. Among the common threads that are linked to prior speculative bubbles are mass-hysteria, corruption, leverage, and a general sense of pride as individuals become egotistically convinced of their own financial acumen and intelligence, and convey that error to others. And, of course, a bubble always surrounds an investment opportunity that is rich in imagined prospects, but negligible in any dispassionate view grounded in reality. Something seemingly exciting and innovative always captures the public’s imagination. In 1720, that innovation was overseas trade with the “new world.” In the 1830’s it was the “steam locomotive” and railroad transportation. In the late-1920’s it was the “automobile” and the independence that it promised. In the late-1990s it was the “internet,” with instant access to information. Today, it’s still the internet, but for some reason they now call it “A.I.” — its true net benefit remains to be seen.

One present day example of a heretofore popular stock, whose price action closely resembles the same bubble dynamics that were on display in the South Sea Company’s stock circa 1720, is Super Micro Computer (SMCI) — Nvidia’s third largest customer! Like the South Sea Company, SMCI was caught up in a buying frenzy driven by mass-hysteria. Leverage was a big factor as the public not only bought the stock on margin, but also drove open interest in SMCI call options to unprecedented record levels. Thousands of posts can be found on social media and in Reddit chat room threads attesting to the incredible financial prospects that lie ahead for the company as a major infrastructure player in the buildout of “A.I.” data centers. Ultimately, the company’s big four auditor — Ernst & Young — abruptly resigned amid deepening investor concerns over SMCI’s accounting practices. We expect many more examples like this to present themselves as the current A.I. bubble deflates — “at least a hundred.”
Macro Overview: It’s a Mad, Mad World
As outlined in last month’s publication — Issue #38 — our top-down economic thesis has shifted from one expecting an immediate downshift in economic growth attended by a recession, to one that is now expecting a more gradual downshift in economic growth, attended by sticky inflation, and a steady deterioration in the employment data. In other words we are looking for a period of stagnation. This condition represents the transition phase of the cycle. To the average investor, economist, or investment strategist — those who have not studied the history of economic cycles — this condition appears to resemble the prelude to a soft landing. The problem with that conclusion is that there are so few instances of such an outcome (precisely one out of 14 since 1945) that it makes for a rather risky supposition

The long-term structural economic cycle looks more like the boom-bust Kondratieff Wave discussed in Issue #36 than the 4-year business cycle taught at universities. If our assumptions are correct on that front, then the stagnation that we’ve alluded to is actually a prelude to stagflation — a sustained period of lower growth, higher inflation, and higher unemployment, which typically attends a period of rolling recessions — a la the 1970s. Under this scenario, the Federal Reserve will find itself hamstrung by its dual mandate of stable prices and full employment. If monetary policy is too easy, then inflation will begin to creep back into the economy. If left too tight, then unemployment will begin to rise. Given the long and variable lags associated with monetary policy changes, the Fed is doomed to always be fighting the last battle even as a new battle begins. Historically, the net result of these back and forth policy actions has been a bifurcated economy.
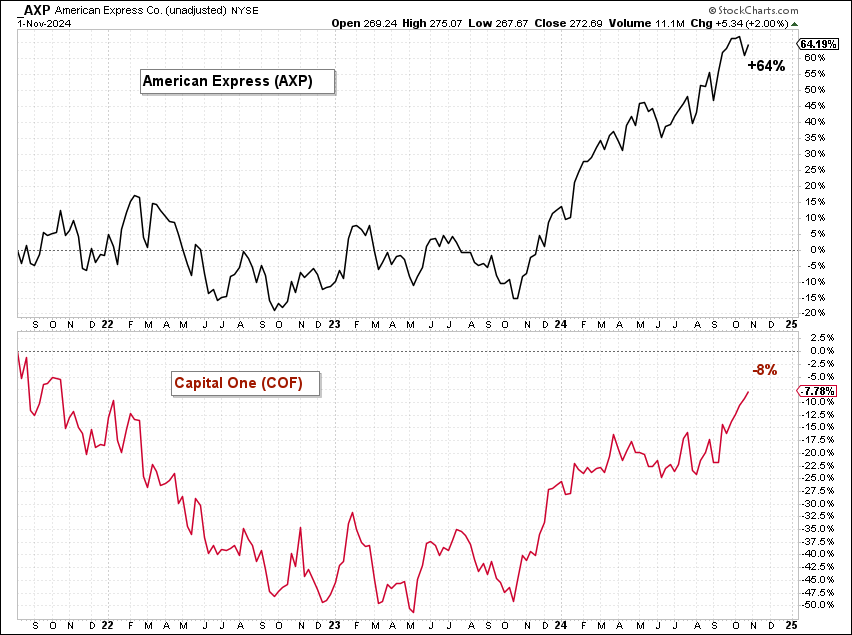
Case and point, the relative performance of these two credit card issuers tell vastly different stories about the health of the U.S. consumer. Since August 2021, the shares of American Express — a status symbol of the top 10% of earners — have gained 64%, while the shares of Capital One Financial — a symbol of the democratization of credit — are down 8%. For the top 10%, the U.S. economy is booming. For the bottom half, it’s in a state of utter stagnation.

Indeed, credit card debt and other revolving consumer loans have reached $1.07 trillion as of month-end September, up from about $750 billion in 1Q21. This represents a heretofore unprecedented rate of growth in unsecured consumer debt. Meanwhile, the personal savings rate in the U.S. has fallen to 4.6% from a recent high of 5.5% in January, and its pre-COVID level of around 7.0%. From a macroeconomic perspective, the net savings rate is a critical indicator of the economic health and future growth potential of a country. A higher net savings rate enhances the overall resilience of the economy by providing households with a cushion during periods of economic downturn and uncertainty. What’s worse is that the vast majority of that diminished net savings is coming from the top 10% of earners.
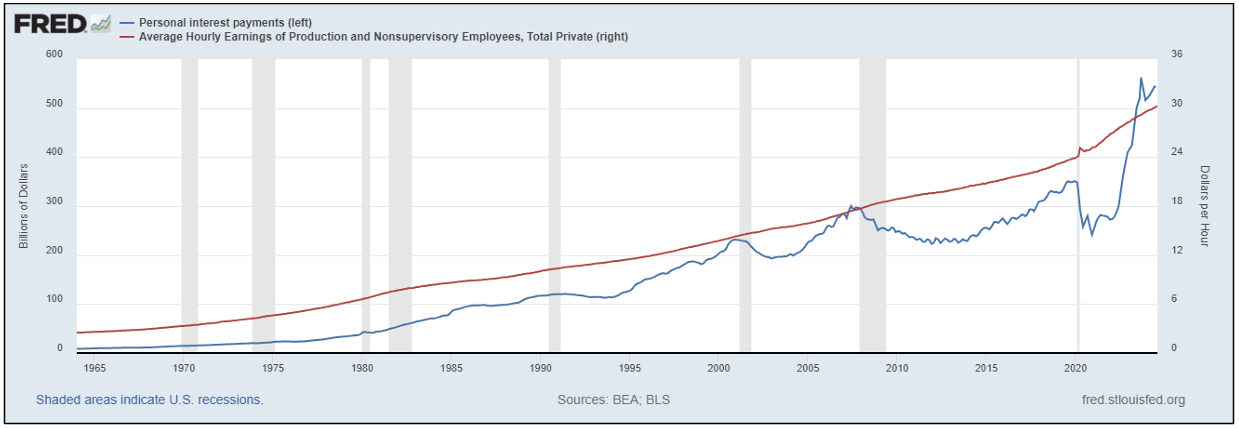
Concomitant with the dramatic increase in credit card debt, personal interest expense — now exceeding half a trillion dollars — is outstripping the growth in average hourly earnings. Since 1965, this has only occurred on one other occasion — during the Great Financial Crisis (GFC) in 2008. What followed was a collapse in consumer spending and the deepest economic recession since the Great Depression. Yet, today, the overshoot in personal interest payments is of a much greater magnitude than during the GFC. Indeed, the data series is already beginning to turn down — a condition that has preceded every past recession.

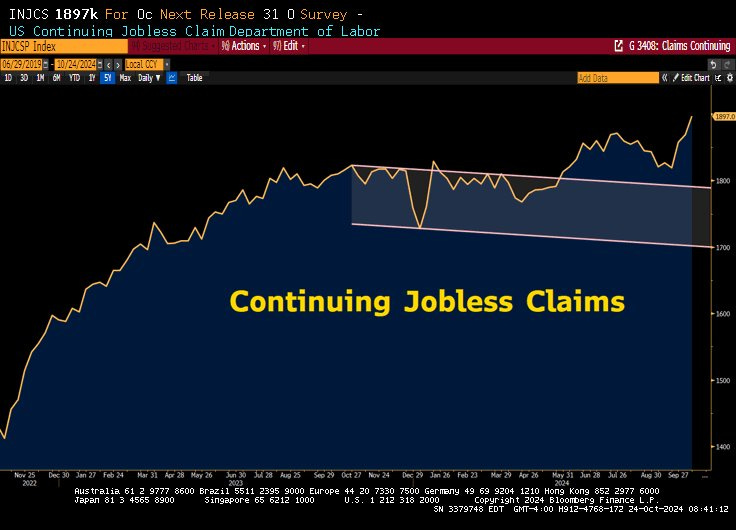
And while the Leading Economic Indicators index has now posted two consecutive months of decline through September — triggering yet another recession signal, the Conference Board’s Consumer Confidence index for October rose more than 11% to a reading of 138, its biggest one-month acceleration since March 2021. According to Dana Peterson, the Conference Board’s chief economist, “Consumers’ assessment of current business conditions turned positive, and views on the current availability of jobs rebounded after several months of weakness.” That sentiment was seemingly at odds with the September Job Openings & Labor Turnover Survey (JOLTS) released on the same day showing that the number of job openings slid to 7.44 million — off more than 400K from the previous month’s downwardly revised level and the lowest since January 2021. That number was also below Wall Street’s forecast for 8.0 million. Meanwhile, continuing claims for unemployment insurance benefits posted a 3-year high on October 24th.
The question thus becomes, how does one reconcile the aggregate strength of consumer sentiment with the clear signs of weakness developing within the labor market, the off-the-charts level of consumer debt, the massive spike in personal interest payments, and the marked deterioration in the personal savings rate? Here’s one possible answer. We follow a dozen different sentiment and positioning measures. There is a lot of noise in the data. Sometimes it becomes difficult to see the forest through the trees. But, one measure that pulls no punches on this subject is the survey of households ‘aggregate financial asset allocation.’ This survey — conducted by the Federal Reserve since 1960 — considers all liquid assets outside of personal real estate holdings. As of October 10th, U.S. households’ aggregate allocation to equities has reached its all-time record high of 48% — only previously attained in March 2000.
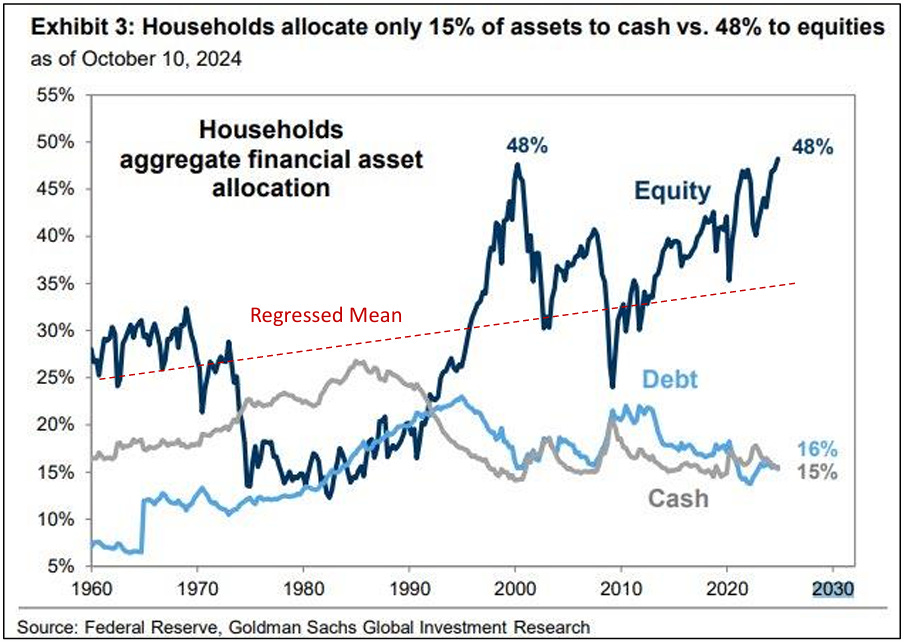
The fact that the S&P 500 is up some 21% YTD, on the heels of a 26% gain in the prior year, is not lost on the consumer. The aggregate decision to increase asset allocations to max long equities, coupled with real estate gains has pushed household net worth to a new all-time record high of $163.8 billion. That’s likely what has made the consumer so confident. But the associated shift in risk taking attitudes has led the average investor to increase his allocation to equities at a time when high valuations, slowing economic growth, and geopolitical uncertainty, make the value of net worths vulnerable to adverse market conditions. Conversely, households aggregate allocation to cash is near its record lows — hovering at just 15%. This leaves the average household with far less financial flexibility, should Newton’s law of gravity make its presence known. As Newton so aptly pointed out in Principia:
“Every action has an equal and opposite reaction.”
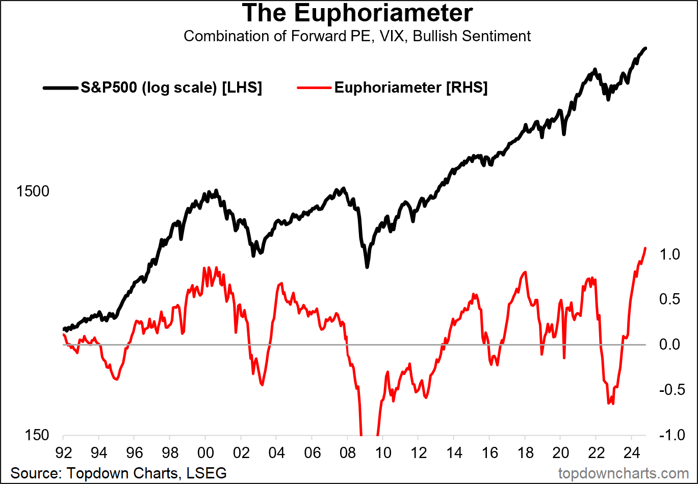
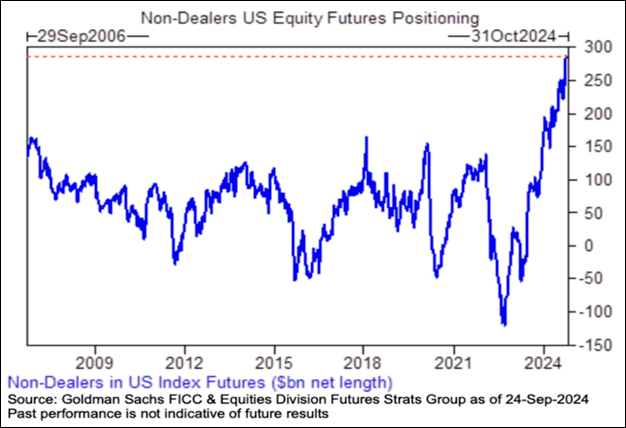
The Euphoria Meter, created by Callum Thomas at Top Down Charts, is a longer-term composite measure of market sentiment, which combines the forward P/E, the VIX, and aggregated surveyed bullish investor sentiment. It ticked-up to another new all-time record high on October 25th. Very simply, the consensus is extremely bullish and the stock market is highly vulnerable to any type of disappointment or adverse shock/surprise. To be sure, U.S. equity futures positioning by investors excluding market-makers recently hit a net long position of ~$290 billion, the highest on record. Since the beginning of the year, net long positioning has more than doubled. This is also twice as high as during the previous peaks seen in early 2018 and 2020. Everyone is all-in on stocks. Everyone can’t be right.
An early mentor and former colleague from our days working on the equity trading desk at Merrill Lynch is a man by the name of Bob Farrell. Bob was the Chief Market Strategist at the firm during our tenure. He is now retired, but still enjoys watching the markets from the comfort of his Florida home at the age of 93. After Bob retired in 1998, he penned a list of Ten Market Rules to Remember based upon his life’s work and experiences. Rule #5 stands out in our mind today: “The public buys the most at the top and the least at the bottom.”

Election Inspection: Democracy’s Discontent
Last weekend, former President Donald Trump held a mega-rally at the sold-out Madison Square Garden. With a capacity of 19,500, and thousands more standing outside the venue, the event’s attendance was by far the largest of the Republican candidate’s campaign. Vice President Kamala Harris held a similarly well-attended rally in Houston, Texas. The average of the latest polls since October 11th show Trump now edging ahead of Harris to win the Presidency — 48.4% to 48.1%.

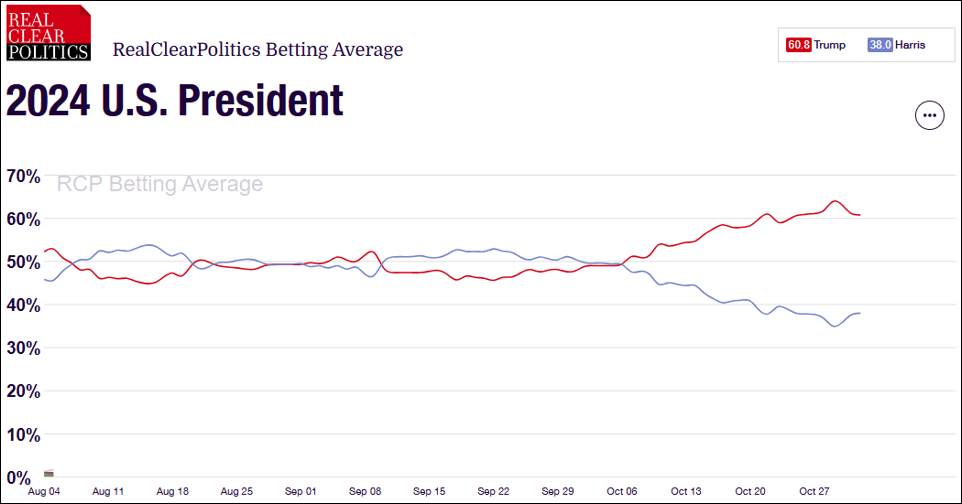
Betting markets are making a much clearer distinction. The average of the eight largest election betting websites have Trump winning by a wide margin. 60.8% of those betting with their wallets have now put their money on Trump to win, while just 38% are wagering that Harris will be victorious.
Five Thirty Eight’s Presidential election model now gives Trump a 52% probability of winning the electoral vote based upon 1,000 simulations, which take into consideration everything from polling data, to campaign fundamentals, economic conditions, to state partisanship, and incumbency. However, the model also projects a 69% probability that Harris wins the popular vote.

Recent media reports suggest that while the entire nation will vote this coming Tuesday on the who will be the next President of the United States, voters in just seven key swing states will decide the outcome of this contest: Arizona, Georgia, Michigan, Nevada, North Carolina, Pennsylvania, and Wisconsin. While the results of the vote in each of these states will remain critical to the end, we can guess with reasonable confidence which candidate will carry all but one these states.