

HUGE INSIGHTS: The Big Picture - Issue #31
HUGE INSIGHTS: The Big Picture - Issue #31
When the Levee Breaks

Please enjoy the free portion of this monthly newsletter with our compliments. To get full access, you might want to consider an upgrade to paid for as little as $12.50/month. As an added bonus, paid subscribers also receive our weekly ALPHA INSIGHTS: Idea Generator Lab publication, which details our top actionable trade idea and provides updated market analysis every Wednesday, as well as other random perks, including periodic ALPHA INSIGHTS: Interim Bulletin reports and video content.

Executive Summary
Fluid Dynamics and Liquidity Risks
The Consensus Forecast is Always Wrong
Valuation Matters: Bottom-Up vs. Top-Down
No Valuation Is Deterring Investment Allocations
Market Analysis & Outlook
Conclusions & Positioning
Fluid Dynamics and Liquidity Risks
Andrey Kolmogorov was a Russian mathematician born in Tambov, a small town located 500 kilometers south-southeast of Moscow, circa 1903. His unwed mother died in childbirth, leaving him an orphan. As a boy, he was educated in his aunt Vera’s village school. Kolmogorov’s earliest mathematical papers were printed in the school’s journal. At just five years of age, he noticed the regularity in the sum of the series of odd numbers: 1 = 1 squared; 1 + 3 = 2 squared; 1 + 3 + 5 = 3 squared; etc. His first-grade paper was later awarded the Wolf Prize in Mathematics in 2001. Kolmogorov was no ordinary first grader. His aunt Vera recognized this, and in 1910 she adopted him in order to see to it that he was properly academically challenged.
In 1920, Kolmogorov entered Moscow State University. By 1922, Kolmogorov had worked out and proved several results in set theory and in the theory of Fourier series. That accomplishment gained him international recognition. After graduating from Moscow State University in 1925, Kolmogorov published his work in constructive logic, which led to an invitation to pursue a Ph.D. in mathematics at Moscow State University. In 1929, Kolmogorov completed his doctoral thesis in probability theory, and in 1931 he published his pioneering work entitled, About the Analytical Methods of Probability Theory. This led to a professorship at Moscow State University. In 1933, Kolmogorov published his next book, Foundations of the Theory of Probability, establishing himself as the world’s leading expert in the field of probability theory.
Around 1941, his interests began to shift toward a more practical area of mathematics known today as “classical mechanics,” where he focused on fluid dynamics and began publishing research on turbulence. He co-authored the Kolmogorov-Arnold-Moser Theorem, which solved the small-divisor problem that arises in the perturbation theory of classical mechanics. He later solved famed mathematician David Hilbert’s thirteenth problem (one of 23 unsolved problems that Hilbert presented at the International Congress of Mathematics in Paris in 1900). But, perhaps, his greatest contribution to mathematics and classical mechanics was his statistical theory of turbulence. Core to that theory was the observation that in order to sustain a turbulent flow, a persistent source of energy is required because turbulence dissipates rapidly as the kinetic energy is converted to internal energy by viscous shear stress — in what Kolmogorov called the “turbulent eddy cascade.”

In fluid dynamics, turbulence or turbulent flow is the fluid motion characterized by chaotic changes in pressure and flow velocity. Turbulence causes the formation of eddies (the swirling of a fluid) of many different diameters. Most of the kinetic energy of a turbulent motion is contained in the large-scale structures. The energy “cascades” from these large-scale structures to smaller scale structures by an inertial and essentially inviscid mechanism. This process continues, creating smaller and smaller structures which produce a hierarchy of eddies. Eventually, this process creates structures that are small enough that molecular diffusion becomes important and viscous dissipation finally takes place. In short, the energy of the turbulent eddy cascade ultimately dissipates completely. Okay, keep all of this in mind as you read on, because we’re going to come back to why this is important in a moment.
In a growing number of circles on Wall Street, the prevailing view has been that the most important factor driving the stock market is liquidity conditions. Believe it or not, this is a relatively contemporary theory, which had its comeuppance after the Nixon administration took the country off the gold standard. It was first put to the test in the early 1980’s when then Fed Chairman Paul Voelker instituted a monetary policy change that proved so restrictive it forced the U.S. economy into two recessions in as many years, in an effort to quash an inflationary condition that had overwhelmed the nation for the better part of the prior decade.
It took the crash of 1987 to persuade his successor, Alan Greenspan, to wield the sword of liquidity to the same extent. Only at that time, it was used with the opposite intention — in an attempt to stabilize equity markets through a process of easing monetary policy with an emergency 50 bps rate cut after having raised the discount rate by the same amount just two months earlier. The success of that endeavor only emboldened the subsequent generation of central bankers to push the edge of the envelope even further with respect to policy support. Indeed, Greenspan himself took the Fed’s benchmark funds rate to 1.0% following 9/11, while his successor, Ben Bernanke, postulated dropping bales of money from helicopters in order to fight deflation, before he himself cut the Federal Funds rate to effectively zero following the onset of the Great Financial Crisis (GFC).

And as if that wasn’t enough, Bernanke took it to the next level instituting a strategy of injecting additional liquidity into the markets through large-scale asset purchases — soaking up trillions of dollars of long-dated Treasury and agency mortgage-backed securities — in a new and previously untested approach dubbed “quantitative easing” (QE). His successor, Janet Yellen, maintained the Fed’s bloated balance sheet, which weighed in at approximately $4.5 trillion both when she took over the post from Bernanke in 2014, until she left the Fed in 2018. Enter Jerome Powell. A lawyer by training with extensive experience in private equity, Powell was regarded initially as a pragmatist. It was his intention to shrink the Fed’s balance sheet back to its pre-crisis levels and to normalize monetary policy. And while his intentions were well-founded, it was not to be so. A rift in the reverse-repo market left those intentions wanting in late-2019, and six-months hence a new crisis of unknown proportions was thrust upon his shoulders.

Powell, being the savvy public servant that he is, decided not to pull any punches as the world fell to its knees during the global pandemic. He not only cut rates back to zero again, but he put the printing presses into overdrive — buying up to $120 billion in long-dated Treasury and mortgage-back securities each month for the next two years until the Fed’s balance sheet reached nearly $9 trillion, or about double the level that he inherited from Yellen. Now, given the reaction from equity markets over the last 35-plus years to Fed liquidity injections, one can see how Wall Street might be inclined to conclude that the most important factor driving the stock market is liquidity conditions. In fact, Wall Street has been trained like one of Pavlov’s dogs. Every time the Fed turns on the liquidity spicket, it’s as if Wall Street hears a bell — and as such, they begin salivating because they expect to be fed. Animal spirits are then stimulated.

The training has been so thorough that Wall Street has since become quite adept at anticipating the Fed’s response to changes in financial conditions. And the Fed has become so confident in that training, that they themselves have concluded that they need only hint at the idea of taking action, and Wall Street’s response to the implied inference will in many instances ameliorate the need to take any action at all. The gamesmanship between the Fed and Wall Street has now reached a level approaching science. Indeed, the Chicago Federal Reserve Bank has gone so far as to create a its own financial conditions index with a look-back period dating to 1972. The index aggregates 105 different measures of financial activity (weighted with both positive and negative values to the second decimal) across three different subindexes designed to monitor risk, credit, and leverage. But even with sophisticated tools of this nature, the Fed was unable to see what would come next. This was because the Fed has also become conditioned. They had learned from experience over the last several decades — be it Japan in the 1990s, the deflatting of the Dot-Com bubble and 9/11, or the post-GFC reflation — that money printing doesn’t necessarily lead to inflation. It’s just liquidity, right? Like fighting fire-with-fire. A controlled burn — so-to-speak. That was until now. The Fed has since learned that when combined with fiscal largesse, enough money printing does lead to inflation — a lot of inflation — just like all of those acarne textbooks of the Austrian persuasion suggested.

This realization caused the Fed to do an about-face in March 2022 — a bit too little, too late — but better late than never. Eleven rate hikes and 525 bps later, the Fed now finds itself in its current predicament. Inflation has been subdued, but like Hannibal Lecter, even though it has been sentenced to death, it can’t be counted out until it receives a lethal injection. In a moment of weakness, Powell allowed his ego to get the better of him. By late-October of last year, the Chicago Fed National Financial Conditions index began to turn up from its recent low. Not much, but enough to warrant concern. The large-scale eddy created by the BTFP facility — that product of the regional banking crisis last year, as detailed in Issue #30 — was no longer generating energy. That energy had cascaded into ever-smaller eddies until it reached the point of viscous dissipation as Kolmogorov’s theory would predict. Knowing that the financial conditions index has propensity for negative surprises, Powell decided not to take any chances. He saw an opportunity to begin playing the game again with Wall Street. And so far, it’s worked. Like Pavlov’s dogs, the market began salivating. The animal spirits were released, and the financial conditions index reversed its ascent.

But the Fed is in a box. Powell’s legacy is at stake. Will he go down in history as the next Paul Voelker? Or the next Arthur Burns? The chart above juxtaposes the S&P 500 index over the Y/Y change in the CPI from 1967 through 1980. As illustrated, the S&P 500 declined -37% from an all-time high in 1968 into its 1970 low as the first wave of inflation reached its crescendo. But Burns was able to subdue inflation over the subsequent two years and in response, the S&P 500 rallied to a then new all-time high by September 18, 1972. What happened next was the determining factor for Burns’ legacy. His ego got the better of him. He concluded that he had slain the dragon. But inflation was still lurking — biding its time. Hannibal Lecter is patient — he waits for just the right moment to strike. When Burns took his foot off the brake, inflation began to rear its ugly head again. In February 1973, the back-tested Chicago Fed National Financial Conditions index shows a surge into positive territory, indicating that something dire was underway. The S&P 500, which at that time was also dominated by narrow group of growth stocks known then as the “Nifty Fifty,” plunged by 49% to its 1974 low as inflation surged and the CPI reached new heights. No one was prepared. No one saw it coming.
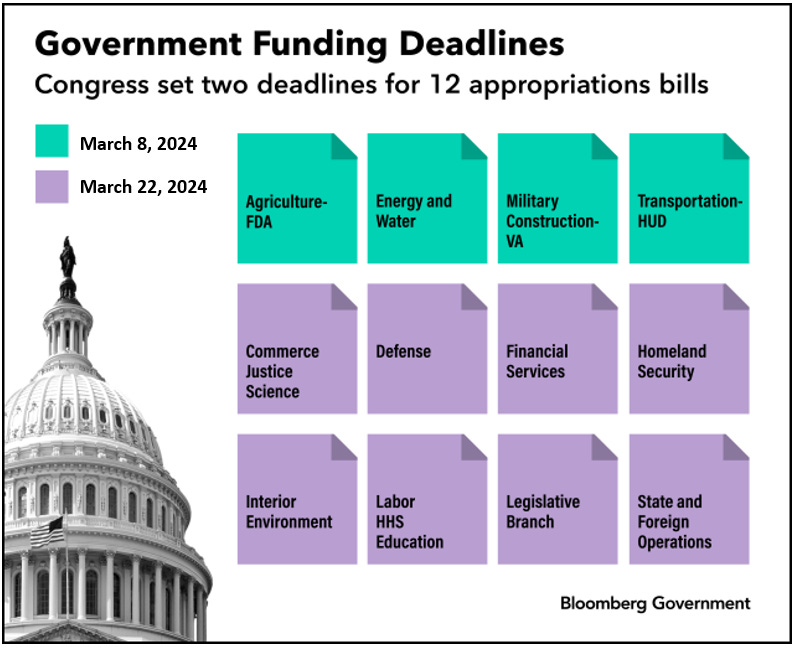
The Core PCE data for January was disappointing for the Fed doves. The ‘Super Core’ PCE Deflator was particularly alarming as it exploded higher with a M/M increase of +0.6%, showing that inflation — ex-food, energy, and housing — is back to the levels seen in December 2021, when the headline CPI was 6.7% and poised to move higher. Today, Powell is facing his Arthur Burns moment — and he knows it. It is an election year, just as it was in 1972. There are cracks forming in the foundation of the financial system as detailed in Issue #29. U.S. Treasury debt has been put on negative credit watch by Moody’s. The government faces another partial shutdown on March 8th, and a total shutdown on March 22nd. The Fed’s BTFP is scheduled to end on March 11th. The Overnight Reverse Repo facility has been drawn down to $570 billion from $2.2 trillion — leaving the Fed to play another guessing game in determining what number constitutes “ample” reserves. The incumbent administration craves a liquidity injection to goose the economy into the election. The U.S. Treasury commands a liquidity injection to absorb the more than $9 trillion in government debt that must be rolled or issued over the next year. The banking system requires a liquidity injection in order to absorb the expected $1.2 trillion in CRE write-downs that are currently buried in their books somewhere. And the stock market has already priced in a liquidity injection — albeit a smaller one than was expected three months ago. Will Powell focus on his legacy, or will he let his ego get the better of him once more? And if the latter, will he complete the Hail Mary pass for a soft landing, or will inflation rear its ugly head again, and dub him Arthur Burns Redux?

But there is still one more question to be asked. Will there be a recession in 2024? That might be the solution. It would provide the Fed the cover it needs to satisfy all of its customers. All except the equity market. The equity market will get exactly what it deserves, regardless of which scenario plays out.
The Consensus Forecast is Always Wrong
Top-down EPS estimates are derived from sector level performance expectations and then aggregated up. These estimates are calculated by dozens of Wall Street economists and strategists who start with a nominal GDP growth assumption for the forward 12-month (FTM) period. They then apply a multiplier to their nominal GDP assumption to arrive at a revenue growth estimate for each sector (in a range of 1-3x based upon each sector’s historical results). Looking at historical margins for each sector, they then make adjustments for various assumptions with respect to changes in overhead (cost-cutting initiatives, layoffs, productivity improvements, etc.) and apply the result to arrive at sector level estimated op-EPS for the FTM period. Finally, they calculate the weighted-average of each sector’s contribution to arrive at their FTM S&P op-EPS estimate. According to S&P Global, the current top-down consensus S&P op-EPS estimates for 2024 and 2025 are $240 and $272, respectively.

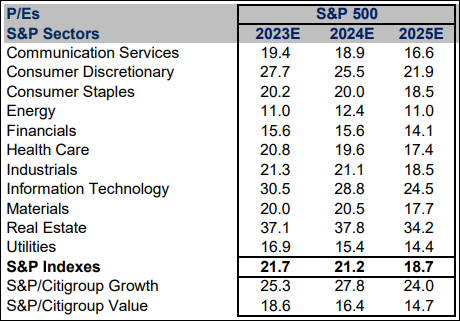
Based upon those estimates, the widely held view on Wall Street is that the S&P 500 is trading at 21.2x FTM S&P op-EPS estimates, and just 18.7x out-year estimates. But, using history as a guide, the actual results could just as likely prove to be $194 and $220 for this year and next. Indeed, the chart above illustrates the percent change in the Wall Street top-down consensus annual S&P op-EPS forecast from the initial forecast to the actual result (25-month percent change) for the 36-year period from 1980 through 2016. The study, conducted by Yardeni Research, shows that the top-down consensus forecast was wrong 100% of the time during that period. The consensus overestimated S&P op-EPS 78% of the time, by an average of +19.0%. The consensus underestimated S&P op-EPS only 22% of the time, by an average of just -6.7%. In short, the Wall Street consensus is a very optimistic cohort of investors.
Valuation Matters: Bottom-Up vs. Top-Down
In our opinion, the S&P 500 is excessively valued. Excessive market valuation is not a catalyst. But it is a warning. It means that in aggregate, investor sentiment has been driving the price of stocks higher by way of P/E multiple expansion, not the fundamental earnings growth of the companies that make up the stock market. But just how excessive is the market’s valuation today? While the previous section looked at the consensus top-down view, this section looks at the consensus bottom-up view.
For the unindoctrinated, Wall Street consensus bottom-up earnings estimates are derived by taking the average of the publishing sell-side fundamental analysts — whose estimates are built by financial modeling of the businesses of each company in the index — and then aggregating them up at the company level. Historically, bottom-up estimates have tended to be much more aggressive than top-down estimates, because the inputs are driven by discussions with the management teams at each company, and they tend to be optimistic about their businesses. Based upon consensus bottom-up estimates for calendar year 2024, using data from LSEG Data & Analytics through 2/23/24, we’ve updated our study of the forward 12-month (FTM) P/E multiple for the top 100 stocks in the S&P 500, which collectively account for 71.8% of the market-cap of the benchmark index.
The study concludes that the largest and most influential 100 stocks in the U.S. equity market are currently trading at an average FTM P/E multiple of 24.4x, and at an index-weighted FTM P/E multiple of 27.9x. That multiple exceeds that which attended the peak of the Dot-Com bubble in March 2000, when the S&P 500 traded at an index-weighted FTM P/E of 25x, based upon the prevailing bottom-up consensus FTM EPS estimates available at that time. As all will know, most of those estimates turned out to be unfounded. Indeed, even if the other 400 index constituents, which account for the remaining 28.2% of the S&P’s market-cap, had a collective index-weighted FTM P/E of zero, the S&P 500 would still be trading at 20.1x consensus FTM bottom-up EPS estimates. Since the top 100 companies in the S&P 500 are expected to produce well-in-excess of half of the estimated S&P op-EPS in 2024, we suspect that the overall index-weighted P/E is probably even higher than 27.9x.
No Valuation Is Deterring Investment Allocations
As the opening cartoon above illustrates, investors are in love with Nvidia. The stock is up more than five-fold since the market bottomed in October 2022, and is beating the S&P 500 by more than 13-fold over the same period. With an equity valuation of over $2 trillion today, Nvidia now stands as the third largest company in the U.S. by market-cap behind Apple and Microsoft, and ahead of Amazon.com and Alphabet. And while the recent revenue and profit growth at Nvidia has been impressive, the table below illustrates the fact that investors have now bid up the valuation of the company’s stock to a point where its market-cap now exceeds that of the entire S&P 500 energy sector (as of 2/9/24). For what it’s worth, it is also now priced at more than double the size of the entire S&P 500 Utilities sector, the S&P Basic Materials sector, and the S&P Real Estate sector, as well.

When we first took note of this comparison, it immediately reminded us of CSCO back in March 2000, when its market-cap had reached $546B — then surpassing MSFT as the most valuable company in the world. The comparison in 2000 was that investors had bid up the valuation of CSCO to a point where its market-cap then exceeded that of the entire global automobile industry. That situation ended very badly for CSCO shareholders.

As such, we began to wonder what other asset values Nvidia’s market-cap has surpassed. Here are just a few: NVDA is now deemed to be as valuable as Saudi Aramco, the national oil company/industry of Saudi Arabia. NVDA is now priced at double the value of the venerable Berkshire Hathaway (BRK/B). NVDA is now priced at 4x the value of Walmart (WMT). It is priced at 10x the value of McDonald’s Corp (MCD). NVDA is now priced at 20x the value of John Deere & Company (DE). It is now priced at 50x the value of Las Vegas Sands (LVS), the largest casino and gaming enterprise in the world. And finally, NVDA is now priced at 100x the value of ArcelorMittal (MT), the largest publicly traded steel producer in the world. Interestingly, Nvidia’s balance sheet shows that the company has just $43 billion in net assets, whereas Saudi Aramco’s balance sheet shows net assets of $468 billion — more than 10x greater.

But why stop at Nvidia. The prospect of a new paradigm driven by artificial intelligence (AI) has captivated the minds of investors, leading to a level of market concentration in mega-cap tech stocks that rivals that of the Dot-Com and Nifty-Fifty eras. According to research compiled by Deutsche Bank, the combined market-cap of the so-called Magnificent Seven (the cohort of AI darlings that includes MSFT, AAPL, NVDA, AMZN, GOOGL, META, and TSLA) now exceeds that of the second largest country stock market in the world (China), and is double the size of the number three market (Japan). Today, Microsoft alone is now larger than 75% of the G-20 country stock markets.

Moreover, the combined profits of these seven companies are now greater than the combined profits of all the publicly traded companies in each of the G-20 stock markets with the exceptions of the U.S., China, and Japan — but only narrowly so with respect to Japan. It is an impressive lot. But there is one concern that appears to have been overlooked — besides the fact that these companies collectively trade at 50x free-cash flow (ex stock-based compensation). None of these business models is recession resistant. Everything that these companies sell is discretionary, including and especially paid search, which relies on advertisers to pay for ad placement — the first line item in every company’s budget to get cut in the event of a recession.
Market Analysis & Outlook
The signs of an impending top are everywhere. On February 24th, Amazon.com replaced Walgreens in the DJIA, and Uber Technologies replaced JetBlue Airlines in the DJTA. Similarly, 25-years ago, back on November 1st, 1999, Microsoft replaced Chevron, and Intel replaced Goodyear Tire & Rubber in the DJIA. Microsoft made it’s high on December 30th of that same year, and then proceeded to decline by 67% over the next 12-months. Microsoft would not see that high again for another 14-years. Intel extended its rally for another eight months before topping on August 28th, 2000. It then declined by 83% into it bear market low of October 2002. It would take another 18-years before Intel would challenge its 2000 high.
Perhaps even more alarming is the March 2nd cover of The Economist. As some readers may know, Paul Macrae Montgomery developed what is now known as the “Magazine Indicator.” Montgomery concluded that when prominent magazines feature a cover story on a financial asset, the prevailing trend has been in force for so long that it is at or very near the point of exhaustion, and tends to coincide closely with the end of an associated trend, because details are already widely known to smart money investors. The more well-regarded the publication, the more involved the vetting process, and the longer it takes to print the story. Therefore, Montgomery concluded, the cover story is best used as a contrary indicator of investor sentiment.

Of all the finance specific periodicals currently in publication, The Economist has by far the worst track record of any with respect making accurate market calls. Their cover stories are now legendary as contrary indicators. If The Economist is asking, “How High Can Markets Go?” Then the answer is, not much further! But, let’s take a more granular look at the stock market’s YTD return by focusing on the parts.