Please enjoy the free portion of this monthly newsletter with our compliments. To get full access, you might want to consider an upgrade to paid for as little as $12.50/month. As an added bonus, paid subscribers also receive our weekly ALPHA INSIGHTS: Idea Generator Lab publication, which details our top actionable trade idea and provides updated market analysis every Wednesday, as well as other random perks, including periodic ALPHA INSIGHTS: Interim Bulletin reports, and quarterly video content.
This month marks the 2-Year Anniversary of HUGE INSIGHTS: The Big Picture. As such, we wanted to begin this issue by extending our gratitude to all of our loyal subscribers for helping to make this newsletter a success. Thank you for your support!
Last weekend, we were fortunate to have spent a good deal of time with our three grandkids. One of their favorite pastimes is to read a book with Grandma and Grandpa. Of course they always pick-out the story. Our oldest presented us with the classic tale, The Teddy Bear’s Picnic. Those of you with children and grandchildren will probably know the story (and the song). It begins,
If you go down in the woods today, you're sure of a big surprise
If you go down in the woods today, you'd better go in disguise
For every bear that ever there was
Will gather there for certain because
Today's the day the teddy bears have their picnic.
Upon reaching the end of the first stanza, we busted out laughing (to the kids delight) as we couldn’t stop thinking of the irony vis-a-vis the brilliant Bob Rich cartoon above. As the bulls revel in their recent success, sitting around the campfire singing Kumbaya, a group of rather sinister-looking bears has encircled the camp. While there may, or may not be a cohort named “Teddy” among them, the question is looming, “Is today the day the teddy bears have their picnic?”
Damn the Torpedoes?
Last month, in Issue #23, we covered the current economic backdrop in exhaustive detail, along with a chronology of how we got here. Our conclusion then was that the U.S. economy is headed for a recession. That conclusion holds today, but what still remains unclear is how long it will take before we get there, and the degree of magnitude that we should expect from said recession when it emerges. One of the most respected economic recession indicators is the shape of the yield curve. A normal yield curve has a positive slope. That is to say, that longer dated Treasury securities earn a higher yield than shorter dated Treasury securities. But for the last 13 months, the opposite condition has persisted. When the yield curve inverts, it is indicative that something is amiss — that there is a problem. Harley Bassman — creator of the MOVE index and a former colleague from our Merrill Lynch days, once wrote, “It’s a stone cold fact that the yield curve is the best predictor of a recession.”
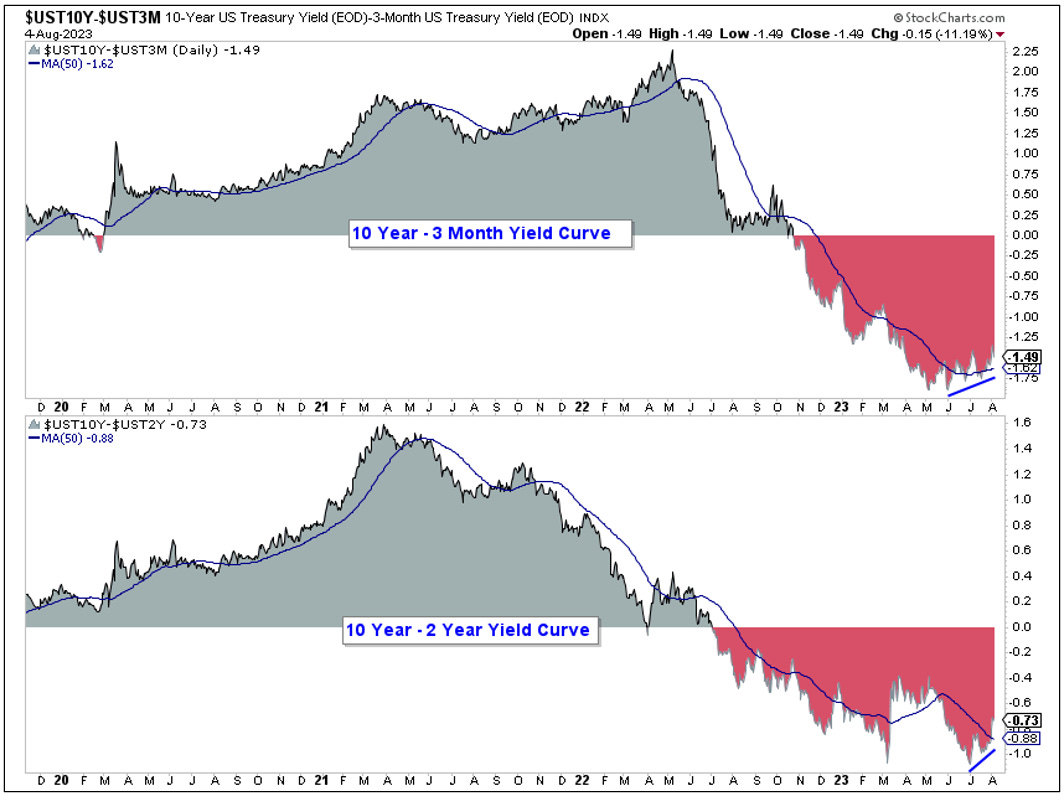
Indeed, an inverted yield curve has preceded each of the past five recessions by as few as 10, and as many as 33 months; it is the proverbial shot across the bow. But it’s not until the curve begins to re-steepen that you know the torpedoes are in the water! As illustrated in the chart above, since June 1st the 10 Year — 3 Month yield curve has begun to re-steepen from a low of -189 bps to a recent high of -149 bps. The 10 Year — 2 Year yield curve has followed suit since July 3rd. Time will tell if this storied recession indicator remains relevant. Even it’s founder, Professor Campbell Harvey of Duke University, expressed some doubts back in January, but he has since reversed his initial opinion — stating in a recent WSJ article, “This recession warning is real.”
We’ve heard a number of commentators refer to the current yield curve inversion as being the deepest in over 40 years. According to Francois Trahan of Trahan Macro, “the depth of a yield curve inversion is not predictive of much. But the duration of the inversion does hold predictive value in that it gives us a sense of how long the subsequent recession might last.” The chart above plots the length of past yield curve inversions versus the duration of the recession that followed. As a general rule, the longer the inversion persists, the longer the recession that follows. Today, the length of the yield curve inversion has exceeded all those that have preceded it since 1957 except: 1973-75, 1980-82, and 2007-09. These, of course, are the three longest recessionary periods on record since the great depression. Yet, the length of the current inversion implies a future recession that lasts almost an entire year.
Real Gross Domestic Income has declined in 3 of the past 4 quarters, while Real Gross Domestic Product has risen over the previous 3 quarters. The difference between Real Gross Domestic Product growth (GDP is growing slowly) and Real Gross Domestic Income growth (GDI is contracting slightly) has just posted the largest divergence on record. The National Bureau of Economic Research (NBER) uses both of these measures of economic activity when determining recessions and they refer to the spread between the two series as the "statistical discrepancy." The NBER notes that the spread was also wide in 2001 and in 2007-09. While it's hard to draw a definitive conclusion from this, it is clear that this condition is not associated with a strong economy. Generally, both GDI and GDP trend in the same direction. If the market’s recovery rally is near its conclusion, then this decline in GDI may be a forewarning of an impending recession.
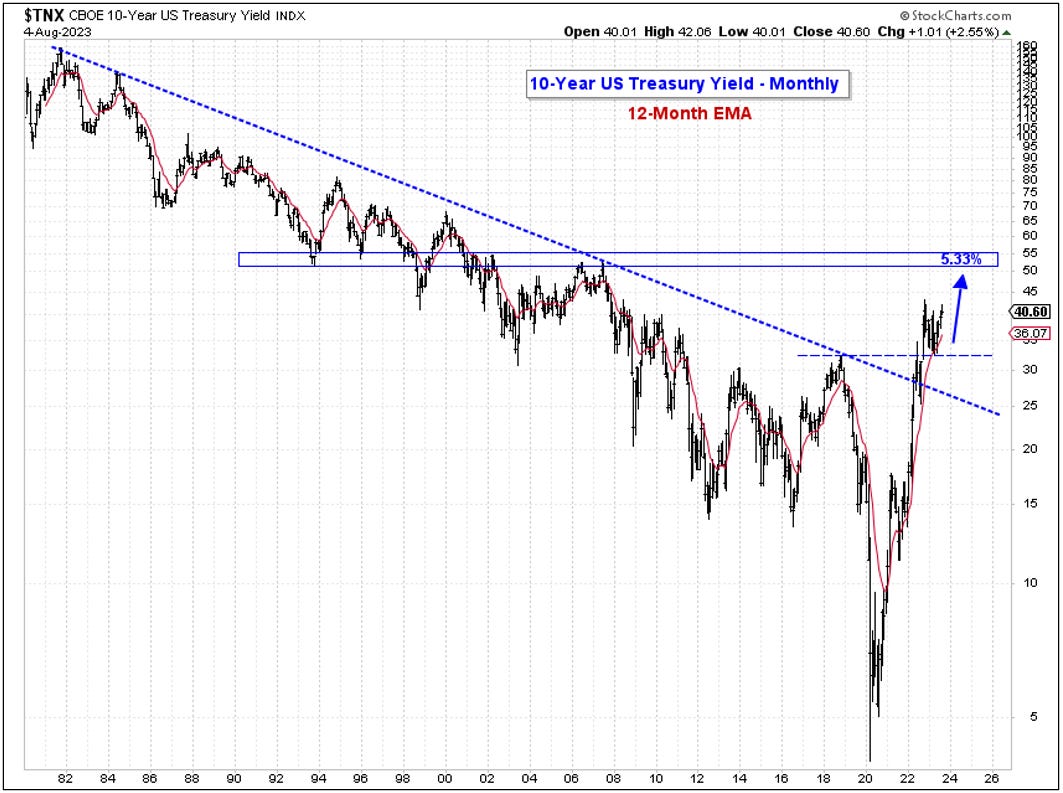
Another thing that’s becoming more clear is the relationship between stocks and bond yields. Since October of last year, there has been something of “grace period” evident with respect to bond yields, as the 10-Year Treasury yield has traded within a 70 bps range over the past nine months, between 4.10% on the upside and 3.40% on the downside (up until recently). This compares to the near vertical ascent experienced from late-2021 through October 2022 when the 10-Year yield vaulted by 300 bps. The inverse correlation between the two series was clear into the October extremes. The subsequent relative calm in Treasury yields has given stocks the breathing room they needed in order to stabilize. But what if the 4.10% upper boundary on the bond yield is sustainably penetrated? We suspect that a move up to the 5.33% area may then be in the cards for 10-Year Treasury yield. If so, how will stocks react — especially those mega-cap growth stocks, whose P/E multiples are very sensitive to changes in interest rates? Our suspicion is that they won’t like it one bit.
As some will know, we’ve been accused of being too bearish during this countertrend advance. But there is one market for which we are well known to be staunchly bullish toward — the rates market. Our forecast for higher 10-Year Treasury yields couldn’t be more out of consensus today. Even the bears expect long rates to decline in the event of a recession. Our reasoning as to why we disagree with that logic is simple — we think that rising 10-year Treasury yields are what will ultimately be blamed for causing the recession. We presented this idea at a conference in Minneapolis last month, while speaking on a panel to an audience of professional investors. One of the other panelists took issue with our view and interjected, “What would possibly cause interest rates to go up by so much?” While we had less than 10 seconds to respond, we did manage to get the following word out of our mouth: “Supply!”
Anyone, Anyone…Voodoo Economics
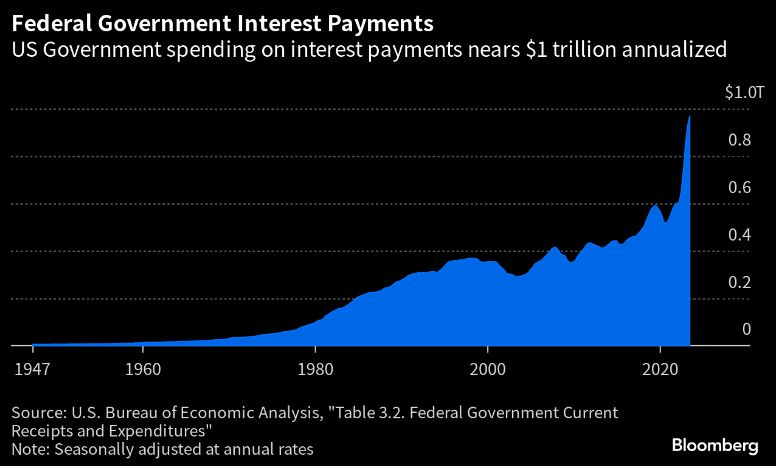
The U.S. government is running the largest deficit in its entire history — in absolute terms — at full employment, no less. According to the Congressional Budget Office (CBO), the 2023 deficit is estimated to equate to 5.3% of GDP. But that’s not all folks. By 2033, the deficit is expected to grow to 6.9% of GDP. The Federal budget deficit has only exceeded that level five times in all of post-WWII history — in the three years following the GFC in 2008-10, and in two years during the COVID crisis in 2020-21. Meanwhile, revenues are expected to decline modestly over the next decade. And as the U.S. government continues to live beyond its means, the estimated interest payments on its debt are poised to soon eclipse $1 Trillion annually, and presently exceed the proposed 2024 annual Defense budget of $874 Billion. With the Debt-to-GDP ratio rapidly approaching 2x, at least one credit rating agency is not impressed. On August 1st, Fitch Ratings cut the United States’ long-term sovereign credit rating to AA+ from a prior AAA. Fitch had placed the U.S. federal government’s rating on negative watch back on May 24th citing, “repeated debt-limit political standoffs and last minute resolutions have eroded confidence in fiscal management.”
On July 31st, the U.S. Department of the Treasury announced its current estimates of privately-held net marketable borrowing for the balance of the calendar year. The Treasury expects to issue no less than $1 Trillion of new debt during the 3rd quarter — about $273 Billion more than their estimate back in May. They further expect to borrow an additional $852 Billion during the the 4th quarter. Coupled with the Fed’s QT, there is more than $2.4 Trillion in net new supply coming on the market into year-end. We think that the Treasury will begin locking-in lower rates at the long-end of the curve in order to prevent interest payments from overwhelming the budget. And all of this deficit spending leads to what end? There is an economic theory now known as the Crowding Out Effect, that was developed in the 18th century and later postulated by John Maynard Keynes. According to the folks at the Wharton School, it basically says that an increase in fiscal stimulus financed by government debt leads to an increase in interest rates, and potentially higher taxes. The increase in interest rates crowds out private capital formation. This decrease in private investment leads to lower income in the economy, and a reduction in the impact of the fiscal stimulus.
Meanwhile, U.S. state and local governments just experienced the worst decline in income tax receipts on record, reaching GFC levels on a Y/Y percentage change basis. This adds another dimension to the problem, because much of the federal spending earmarked for infrastructure development over the next decade requires a matching state spending commitment. As such, it should be no surprise to hear that state and local government debt issuance is also expected to spike significantly in the months and years immediately ahead.
Welcome to La La Land
To be sure, equity investors tend to ignore the complicated and glacially slow relationship between debt and GDP — and its implications for rates. They dismiss it as an anachronism. It’s for this reason that equity investors can maintain such a cavalier attitude toward risk in the face of what may prove to be the proverbial straw that breaks the camel’s back.
Take, for instance, the NAAIM Exposure Index — the two-week moving average of survey responses from professional investment managers. The index just reached 101.82%, indicating that professional investor are so optimistic about the future that they are now leveraging their equity exposure. And it’s not just a new recovery high, but the highest level witnessed since November 2021 — when the Nasdaq indexes both posted their all-time record highs. This is supported by the latest Investors Intelligence Advisors’ Survey (not shown), which confirmed that advisors continue to amp up their bullish stance as well. The percentage of bullish advisors (bulls/(bulls + bears)) has now increased to 75.4, achieving a new all-time record extreme — despite the fact that all of the major indexes are still below their 2021/22 peaks.
Similarly, results from the weekly AAII sentiment survey last week saw the number of individual investors describing themselves as bullish jump to a recovery high of 51.4%, while those describing themselves as bearish fell to 21.5% — the lowest level since February 2021, when Cathie Wood’s ARKK fund posted its all-time record high. The Bull-Bear spread ended the month of July at a new recovery high of +29.9%. That compares to the October 2022 lows of -42% — a more than 70 percentage point bullish reversal in investor sentiment from this notoriously bearish cohort. When optimism reaches extremes such as these, investors should understand that the recovery trade is very long-in-the-tooth, and that a major trend reversal is likely not far off.
Also ignored, has been the steady decline in bottom-up, forward S&P op-EPS estimates for calendar years 2023 and 2024, which have plunged over the past year by 12% and 8.5%, respectively. Indeed, if the trend is your friend, then the current estimates are not be believed. As stated above, our top-down economic analysis continues to point toward a high probability of recession in 2H23 through 2H24. The initial re-steepening of the yield curve, the negative Y/Y growth of the LEI index, and the historic collapse in M2 growth and related tightening of lending standards all suggest the point of no return may be very near, if not already be upon us. Assuming that S&P op-EPS peaked in 2022 at $218, then an EPS drawdown of 29.5% (the average peak-to-trough decline during recessions since 1957) would target $155.
Our work is somewhat more conservative, and assumes that an EPS drawdown will be back-end loaded. We expect 2023 S&P op-EPS to decline by 5% and 2024 op-EPS to decline by 10% — or about half the historical average recession driven earnings drawdown in total. Our 2024 op-EPS estimate is now just 24% below the street consensus top-down forecast. We think that if our 2024 estimate misses the mark, it will most likely be because it’s still way too high. However, if our estimate does prove to be in the ballpark, then the S&P 500 is now trading at a P/E multiple of at least 24x out-year earnings. For the record, we consider the street’s current 2025 S&P op-EPS estimate of $274 to be utterly ridiculous! There can be no doubt that if a recession is in the cards for the next 12-months, then valuations should soon begin to matter.
Yet, as of July 31st, total U.S. Market Cap-to-GDP was hovering at 172.6% — below the 2022 all-time record extreme of 209.4%, but still above its prior cycle high of 142.9% recorded in March of 2000. In addition, the Shiller cyclically-adjusted Price-to-Earnings ratio closed the month of July at 32.0x vs. its 2022 cycle high of 38.6x, and a historical average of 17.3x. The S&P 500’s Dividend Yield continues to plumb its historical lows, currently 1.50%, while its Price-to-Sales ratio is 2.62x — down from an all-time record high of 3.1x, but still above the March 2000 cycle extreme of 2.1x. Price to Book-Value came in at 4.48x — below the 2000 peak of 5.0x, but more than double the 2009 trough of 1.7x. To say the least, it does not appear that the market is pricing in an imminent recession over the next year. In fact, all of these valuation measures currently rank in the top decile of the historical record. Bulls be advised, based upon research produced at The Leuthold Group, the forward 10-year average annual return for the S&P 500 from the top valuation decile — looking at data from 1926 to present — is a whopping 3.25% in nominal terms.
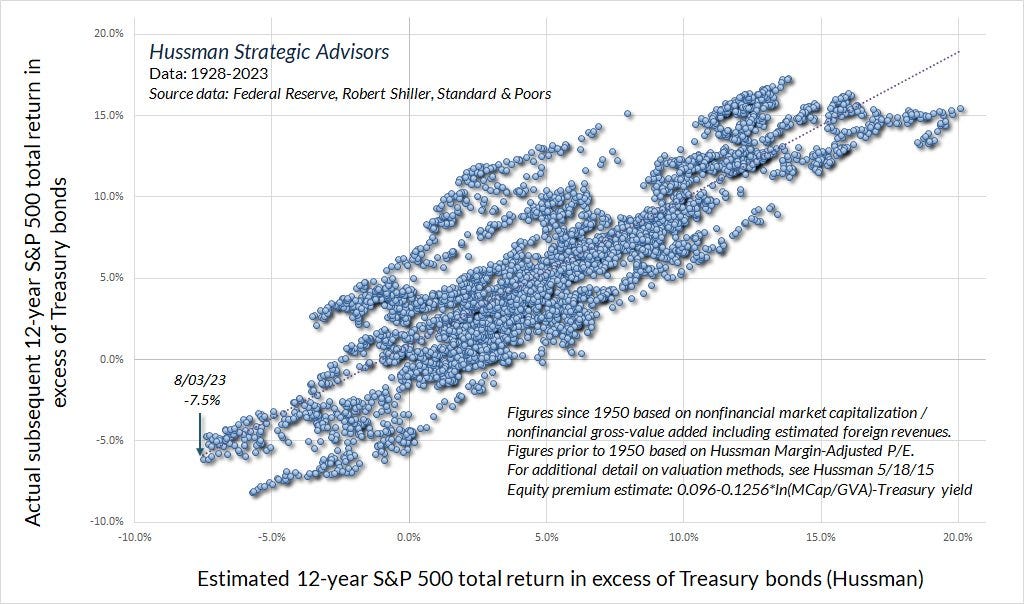
In case you find the above statistic difficult to believe, here’s a second opinion. According to John Hussman, PhD., the 12-year equity risk premium is currently -7.5% — the worst in history. The only other instance that it was even in the same neighborhood was at the March 2000 peak. From that point, Hussman says the S&P 500 lagged the total return of the 10-year Treasury note by 600 bps annually until 2012!
Turn! Turn! Turn!
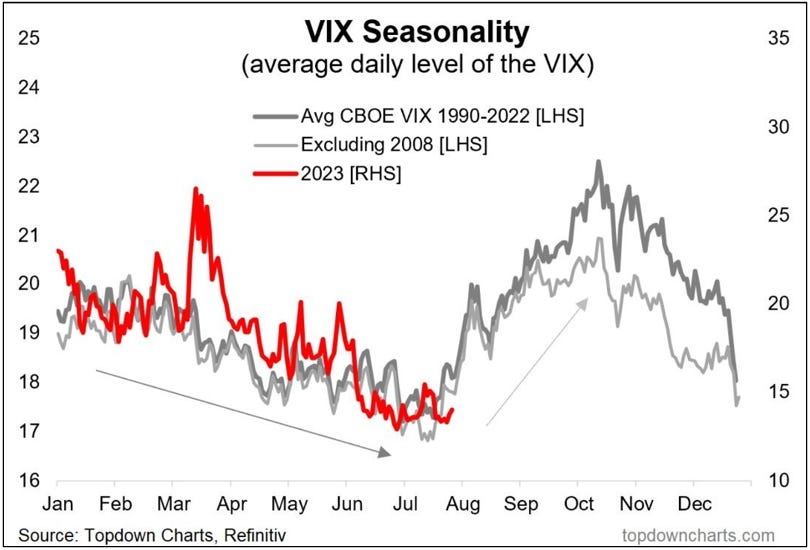
In our last issue, we discussed seasonality with respect to the stock market. It is captured in the S&P 500 Cycle Composite data from Ned Davis Research, which includes the one-year seasonal cycle. This month, we feature a new perspective on seasonality. The chart below illustrates the one-year seasonal cycle of the CBOE Volatility index (VIX). Looking back to 1990, the VIX has tended to bottom for the year in mid-July before rallying to its highs for the year in mid-October.
The VIX ended the month of July at 13.63%, but has surged above 17% during the first few sessions of August. The recent low levels of the VIX reached during June and July indicates that the market had become more complacent than at any other time in the last 41 months. One possible explanation for this condition is the sudden popularity of 0DTE options, which appears to have created a positive feedback loop in several heavy-weight, mega-cap tech stocks. This likely led to a gamma squeeze, forcing market makers to chase these stocks higher over the past two months in order to maintain a delta neutral hedge book, thus artificially suppressing volatility — at least temporarily.
Another explanation is that put option buyers were getting tired watching their option premium decay and expire worthless month after month in anticipation of a recession that has been like waiting for Godot. More recently, we have confirmed that many large investors appear to be funding their purchases of downside protection by selling “extreme” downside protection (a classic “put spread” strategy), whereby the put option buyer goes long a nearby strike (e.g. SPX 4400) and sells short a deep OTM strike (e.g. SPX 3800). This theory is supported by the reversal in the SKEW index off its recent highs. Importantly, just as positive gamma can drive forced buying, negative gamma can drive forced selling. In our view, the alligator jaws illustrated in the chart above appear poised to snap shut in the weeks and months immediately ahead. If correct, we would expect volatility to surge toward 40% or higher before marking the next peak in the VIX.
Geopolitical Considerations
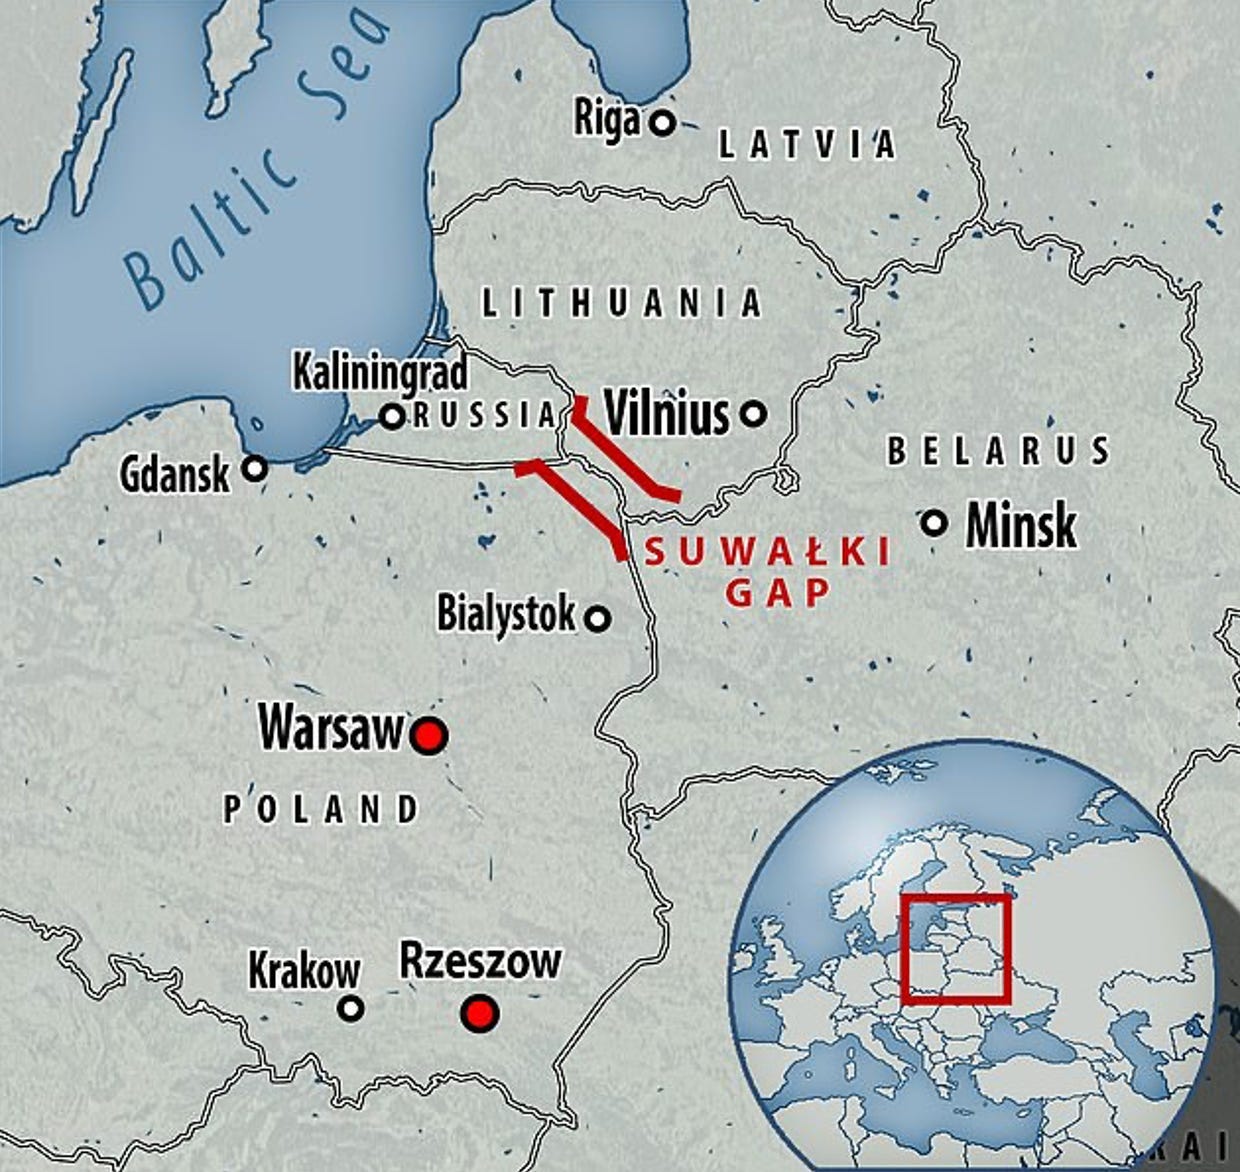
It’s looking more and more as though Putin and the Wagner group pulled the wool over the eyes of NATO and the international community of geopolitical pundits. What was originally thought to be an attempted coup d'etat by Wagner chief Yevgeny Prigozhin, over the amount of Wagner-blood spilled in Ukraine, may have been nothing more than a bit of good old fashioned rope-a-dope from Putin and his long-time comrade. The theatrics that followed led to a presumed settlement between Putin and Prigozhin, whereby the Wagner group and Prigozhin would be exiled to Belarus, and allowed to live out there days fully armed, so that they could continue to train, in order to keep up moral. To what end, you ask? Two words come to mind: Suwalki Gap — aka NATO’s Achilles heel.
The Suwalki Gap is a 40-mile stretch of land that borders Lithuania to its North and Poland to its South. It connects Belarus to a small parcel of Russian territory on which the port city of Kaliningrad resides. If the Wagner group were able to regroup and secure this vital corridor, it would allow Russia to create a wedge that separates the West from the Baltic states — Latvia, Lithuania, and Estonia — all of whom have been seen by Putin as a thorn in the side of Russia ever since their independence. If this were to play out, what is the endgame for Putin? A direct provocation of war with NATO? It’s easy to imagine that NATO may elect not to respond. But Poland is about to have the largest military force in Europe. They have already been amassing troops and other military assets along the border of Belarus. With their tough attitude toward Russian military adventurism, it’s not inconceivable that Poland may be willing to engage Russia without direct involvement from NATO. Is the war in Eastern Europe just getting started? Stay tuned!
On the other side of the world, it appears that the Chinese are not taking ‘no’ for an answer with respect the having access to high performance semiconductor chips. In response to the Biden administration’s export ban, the Chinese have implemented export controls of their own on two key inputs to the manufacturing process of high performance semiconductors — gallium and germanium. These metals are not naturally found, but are by-products of the refining process for bauxite and zinc ores. And while there is no shortage of the metals per se, because of China’s huge competitive cost advantage, it has kept competitors out of the market until prices rise sufficiently to create a profit motive for idle producers. If China were to completely cut-off access to these key ingredients for U.S. chip makers, it could take years for other operators to scale up production to levels necessary to fill the void.
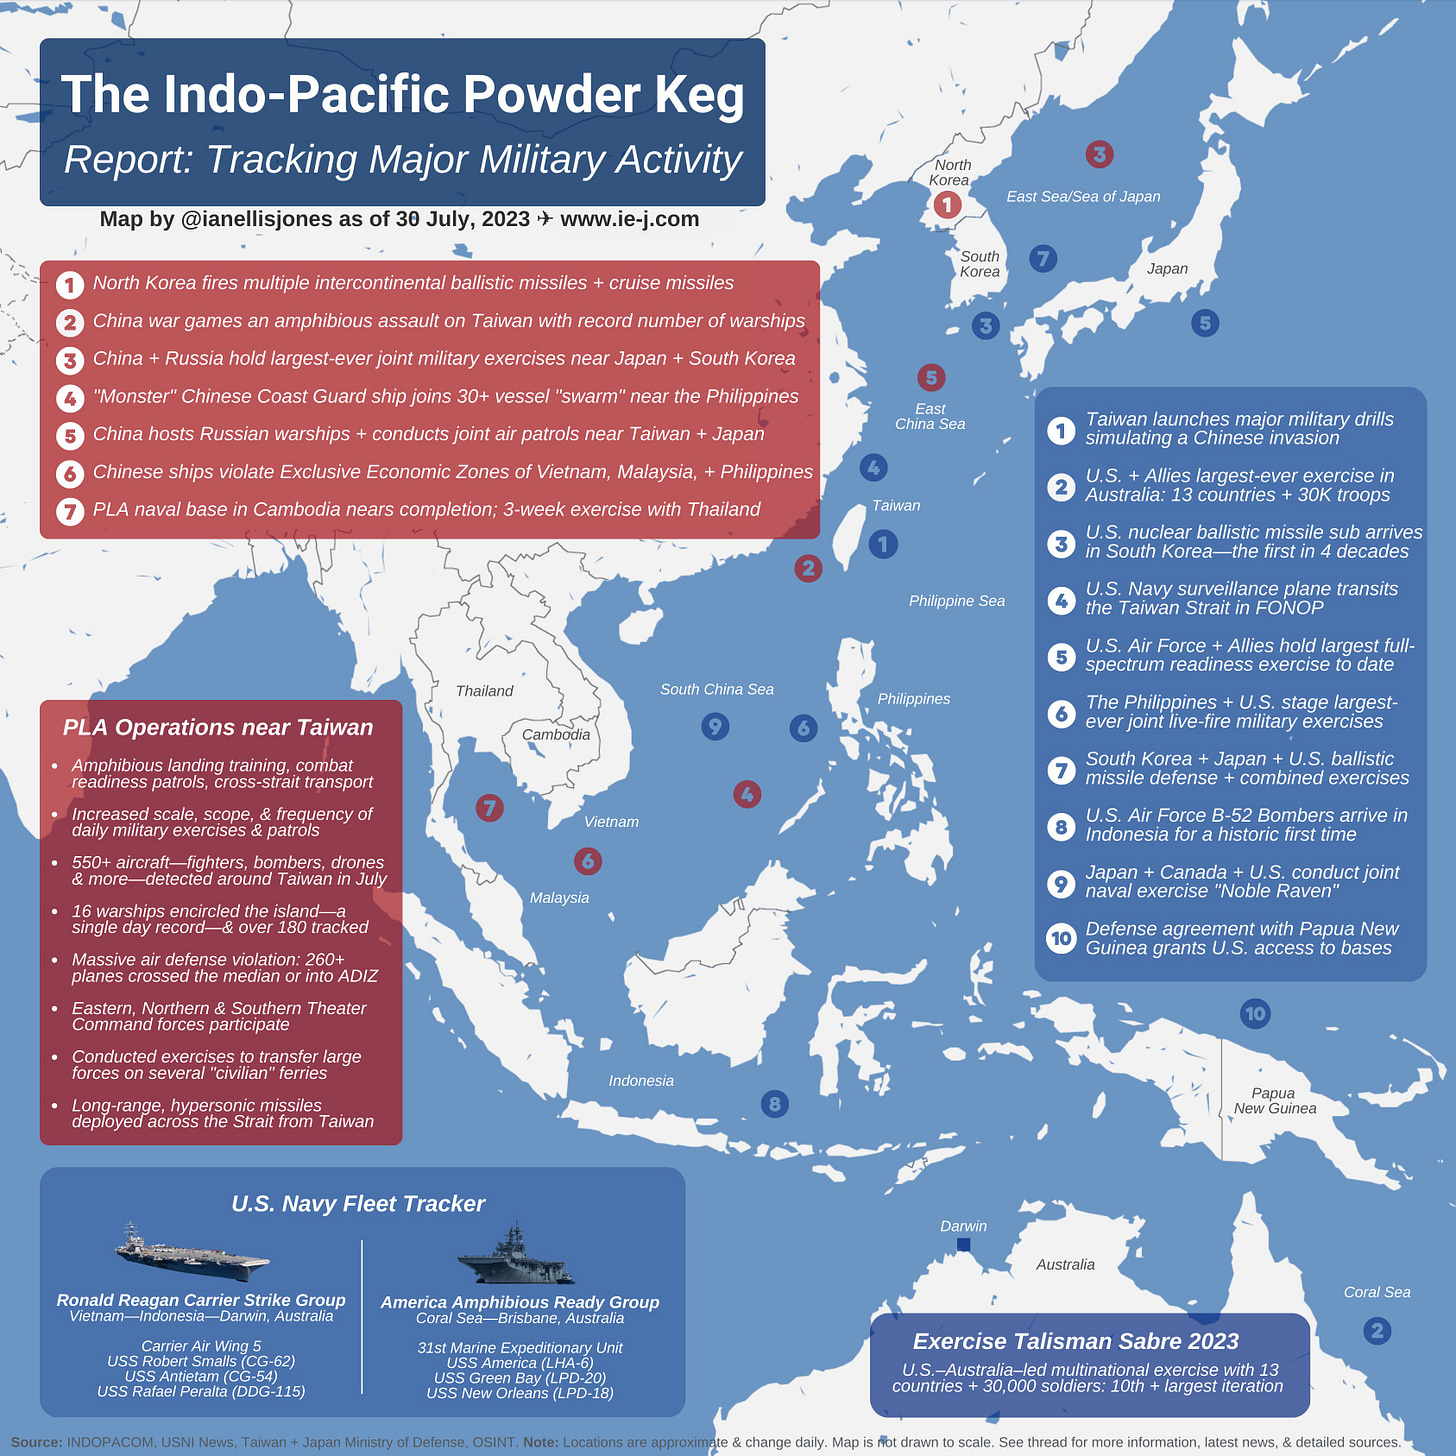
As tensions with China continue to broaden, the U.S. has moved aggressively in recent months to expand its strategic military alliances within and around the Indo-Pacific theater of operations. The Biden administration is seeking a U.S.-Japanese-Korean trilateral defense alliance to reinforce the existing bilateral defense alliances that have existed for decades between Washington and both Tokyo and Seoul. In the face of regular ICBM and cruise missile launches from North Korea, and now joint-naval exercises between the PLA and Russian warships in the East China Sea, the U.S. and its allies are highly motivated to create an effective deterrent to any hostilities in the region. Moreover, in a significant show of force, a U.S.-Australia-led multinational exercise called Talisman Sabre 2023 (TS23) kicked-off on July 30th with 13 countries and 30,000+ joint military personnel. This is the 10th and largest iteration of this annual exercise. Early reports suggest that TS23 has set a new benchmark for combined military training in Indo-Pacific defense. As illustrated in the diagram below, the stakes are quite high as the superpowers vie for a position of dominance.
Yet, while the rhetoric in the press may appear heated — with harsh threats of air and naval blockades, or even the deployment of tactical nuclear weapons, our research suggests that behind closed doors, Russia, China, and the U.S. are even more focused on arriving at a deal that would prevent a kinetic war from spilling over into the Suwalki Gap or Taiwan. Indeed, it would appear most likely that China and Russia are using the threat of such military actions in order to force the U.S. to the negotiating table. The problem is that both of these rivals want far more than the U.S. is willing to give. In addition to Taiwan, China has been busy staking out claims in many other places including Okinawa and the Ryuku Islands, and more recently the Solomon Islands. Russia, as all will know, has been trying to reassemble the former Soviet Union for more than a decade. As for the U.S., it just opened an embassy on the island of Tonga — a strategically significant location North-Northeast of New Zealand. Our sources tell us that to work, any such deal must include a divvying up or mutual recognition of certain key global assets.
Market Analysis & Outlook
A few weeks ago, a friend — an ex-floor trader and expert technician — proposed a theory to us. He said he thought that it might be possible for the S&P 500 to make a slight new all-time high in order to draw everyone back into the market right before a major trend reversal and a market crash. While we remain unconvinced about the prospect of a new high, his theory did get us thinking. The theory made a lot of sense from a contrarian’s perspective. But the more we thought about it, the more we were reminded of the “Lessons from Citigroup.”


