

HUGE INSIGHTS: The Big Picture - Issue #41
2025 Investment Outlook

Please enjoy the free portion of this monthly newsletter with our compliments. To get full access, you may want to consider an upgrade to paid for as little as $12.50/month. As an added bonus, paid subscribers also receive our weekly ALPHA INSIGHTS: Idea Generator Lab publication, which provides updated market analysis and details our top actionable trade idea every Wednesday, as well as periodic ALPHA INSIGHTS: Interim Bulletin reports when we identify an important trend change between our regularly scheduled publications. Thanks for your interest in our work!
Executive Summary
Stukas Over Disneyland
Macro Perspectives: Back to the Nifty Fifty
Geopolitical Perspectives: Kalaallit Nunaat
Market Analysis & Outlook: Nobody Knows
Conclusions & Positioning: The Point of No Return
Stukas Over Disneyland
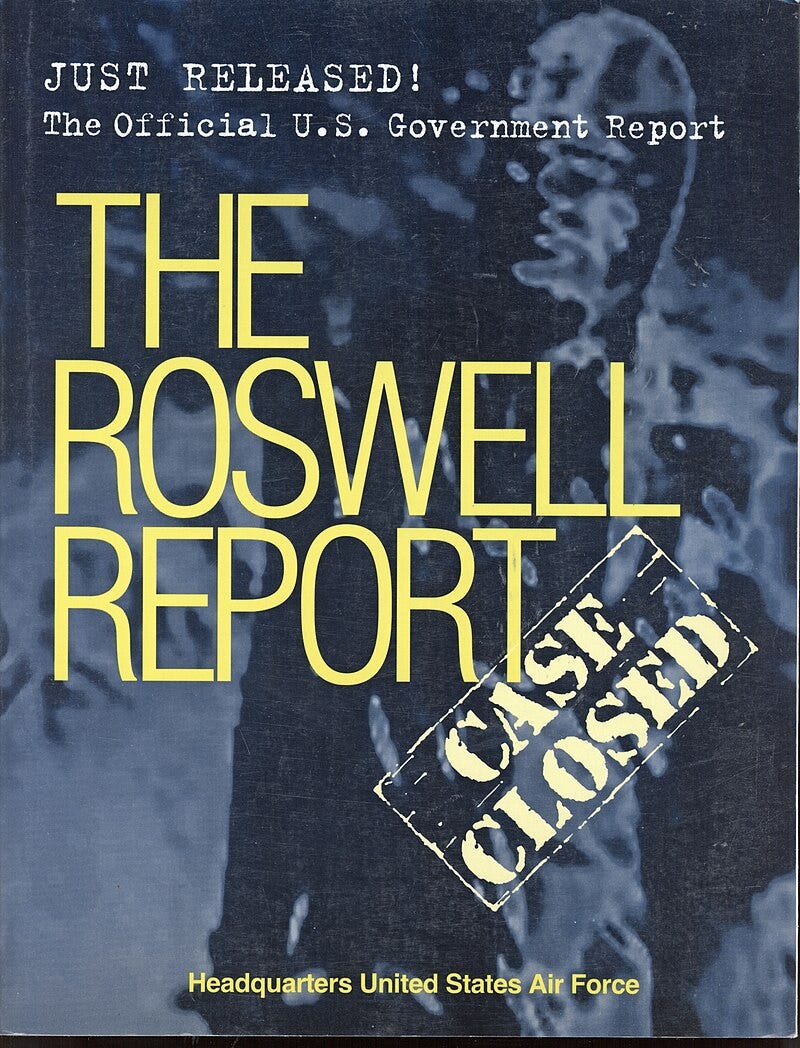
On July 8, 1947, Roswell Army Air Field public information officer Walter Haut issued a press release stating that the military had recovered a “flying disc” near Roswell, New Mexico. The press release read:
“The many rumors regarding the flying disc became a reality yesterday when the intelligence office of the 509th Bomb group of the Eighth Air Force, Roswell Army Air Field, was fortunate enough to gain possession of a disc through the cooperation of one of the local ranchers and the sheriff’s office of Chaves County. The flying object landed on a ranch near Roswell sometime last week. Not having phone facilities, the rancher stored the disc until such time as he was able to contact the sheriff’s office, who in turn notified Maj. Jesse A. Marcel of the 509th Bomb Group Intelligence Office.”
Since then, and until November 2024 — during the official U.S. House Committee on Oversight and Accountability hearings on Unidentified Anomalous Phenomena (UAP), the U.S. government, and more specifically, the U.S. military, has been quite cautious with respect to making official statements related to UAPs — and for good reason.
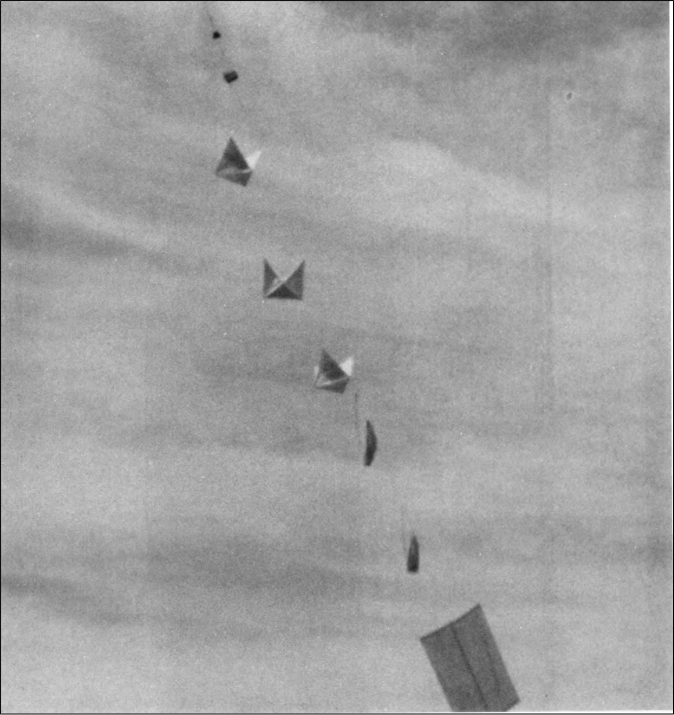
Project MOGUL was a top secret operation conducted by the U.S. Army Air Forces involving microphones flown on high-altitude balloons, whose primary purpose was long-distance detection of sound waves generated by Soviet atomic bomb tests. The project was carried out from 1947 until early 1949. It was a classified portion of an unclassified project by New York University atmospheric researchers. On June 4, 1947 researchers at Alamogordo Army Air Field in New Mexico launched a long train of these balloons — approximately 657 feet in length; they lost contact with the balloon-array within 17 miles of W.W. “Mac” Brazel’s ranch near Roswell, New Mexico where a balloon subsequently crashed. Later that month, Brazel discovered tinfoil, rubber, tape, and thin wooden beams scattered across several acres of his ranch.
The Roswell incident became what is now well-known to be a conspiracy theory alleging that the supposed 1947 U.S. Army Air Forces balloon debris recovered near Roswell, was actually a crashed extraterrestrial spacecraft. Do you see where we’re going with this? Today, the internet is abuzz with fantastical stories and video footage of all manner of glowing balls of light hovering over New Jersey — and everywhere else for that matter. The story has moved from a number of sensationalist social media sources, to FOX News, and now the mainstream media. The official response has been predictable. State and Federal authorities have concluded that there is no threat to national security. Yet, new footage proliferates daily on Tik Tok, X, and Instagram asking the question: Are we alone in the universe?

The footage that we’ve reviewed ranges from single or multiple balls of red, white, or green light dancing randomly in the sky in perfect formation, then abruptly disappearing (a low powered laser pointer shown through a prism onto a clear glass window pane?); to a variety of digitally-altered videos showing game quality “spacecraft” overdubbed onto actual digital video of real life backdrops; to video of erratically flown aerial drones with flashing or steady state lighting; to live-fire warzone video of surface to air missiles and interceptor aircraft; to low flying small aircraft; to film clips from sci-fi movies of fictional spacecraft flying gracefully through the sky — including one that was obviously the Millennium Falcon of Star Wars fame. Much of the footage that has found its way into the hands of the media appears to be part of a wide-spread hoax, or a misinterpretation of what is actually being viewed. Adding to our skepticism is the fact that most of these videos have been posted by witnesses who appear to be enthusiastic about the prospect of an extraterrestrial encounter, rather than concerned for their own safety — apparently lacking the fight or flight response initiated by the amygdala, which is physiologically programmed into the human brain. Although, in one case, a man’s hair did stand on end.

Could there be actual drones flying over nuclear weapons facilities in New Jersey or nuclear power plants in South Carolina during the middle of the night? There could. Could they be foreign government controlled spycraft? Perhaps. Is it possible that the earth is being visited or explored by extraterrestrial beings? Anything is possible. But is it probable? Not in our opinion. More likely, as was the case in 1947 with respect to the Roswell incident, the sudden national obsession with UAPs is a convenient cover story for something else that is actually going on. A form of misdirection, designed to use actual events to distract the public from recognizing the underlying truth. But what is that truth? In 1947, it was the real threat of Russian espionage targeting U.S. nuclear secrets.
Julius Rosenberg was born on May 12, 1918, in New York City to a family of Jewish immigrants from the Russian Empire. His parents worked in the shops of the Lower East Side as Julius attended Seward Park High School. Julius became a leader in the Young Communist League USA while at City College of New York during the Great Depression. In 1939, he graduated with a degree in electrical engineering. Ethel Greenglass was born on September 28, 1915, to a Jewish family in Manhattan. She had a brother, David Greenglass. She originally was an aspiring actress and singer but eventually took a secretarial job at a shipping company. She became involved in labor disputes and joined the Young Communist League, where she met Julius in 1936. They married in 1939.
Julius Rosenberg joined the Army Signal Corps Engineering Laboratories at Fort Monmouth, New Jersey, in 1940, where he worked as an engineer-inspector until 1945. He was discharged when the U.S. Army discovered his previous membership in the Communist Party USA. Important research on electronics, communications, radar and guided missile controls was undertaken at Fort Monmouth during World War II.
According to a 2001 book by his former handler Alexander Feklisov, Rosenberg was originally recruited to spy for the interior ministry of the Soviet Union, NKVD, on Labor Day 1942 by a former spymaster Semyon Semyonov. By this time, following the invasion by Nazi Germany in June 1941, the Soviet Union had become an ally of the Western powers, which included the United States after the attack on Pearl Harbor. Rosenberg had been introduced to Semyonov by Bernard Schuster, a high-ranking member of the Communist Party USA and NKVD liaison. After Semyonov was recalled to Moscow in 1944 his duties were taken over by Feklisov.

Rosenberg provided thousands of classified reports from Emerson Radio, including a complete proximity fuse. Under Feklisov’s supervision, Rosenberg recruited sympathetic individuals into NKVD service, including Joel Barr, Alfred Sarant, William Perl, and Morton Sobell, also an engineer. Perl supplied Feklisov, under Rosenberg’s direction, with thousands of documents from the National Advisory Committee for Aeronautics, including a complete set of design and production drawings for Lockheed’s P-80 Shooting Star, the first U.S. operational jet fighter. Feklisov learned through Rosenberg that Ethel’s brother David was working on the top-secret Manhattan Project at the Los Alamos National Laboratory; he directed Julius to recruit Greenglass.
In February 1944, Rosenberg succeeded in recruiting a second source of Manhattan Project information, engineer Russell McNutt, who worked on designs for the plants at Oak Ridge National Laboratory. McNutt’s employment provided access to secrets about processes for manufacturing weapons-grade uranium. The U.S. did not share information with, nor seek assistance from, the Soviet Union regarding the Manhattan Project. The West was shocked by the speed with which the Soviets were able to stage “Joe 1”, its first nuclear test, on August 29, 1949. However, Lavrentiy Beria, the head official of the Soviet nuclear project, claimed that he used foreign intelligence only as a third-party check and that the development was indigenous.
In January 1950, the U.S. discovered that Klaus Fuchs, a German refugee and theoretical physicist working for the British mission in the Manhattan Project, had given key documents to the Soviets throughout the war. Fuchs identified his courier as American Harry Gold, who was arrested on May 23, 1950. On June 15, 1950, Greenglass was arrested by the FBI for espionage and soon confessed to having passed secret information on to the USSR through Gold. He also claimed that Julius Rosenberg had convinced David’s wife Ruth to recruit him while visiting him in Albuquerque, New Mexico, in 1944. He said Julius had passed secrets and thus linked him to the Soviet contact agent Anatoli Yakovlev. This connection would be necessary as evidence if there was to be a conviction for espionage of the Rosenbergs. On July 17, 1950, Julius was arrested on suspicion of espionage, based on Greenglass’ confession. On August 11, 1950, Ethel was arrested after testifying before a grand jury. On March 29, 1951, the Rosenbergs were convicted of espionage. They were sentenced to death on April 5 under Section 2 of the Espionage Act of 1917. On June 19, 1953 Julius and Ethel Rosenberg were executed by electric shock at Sing Sing prison.
It would be a logical deduction to conclude that the Federal government is conducting some type of military-backed operation of significance, that includes the wide-scale use of aerial drones above and around the northeast and eastern coast of the United States. But for what purpose? One of the more plausible theories that we have entertained is that a search for something or someone presumed to be on the move under the covered of darkness is underway. Another theory that has some merit is that the military is using “advanced technology” drones to scan the area in search of a lost nuclear submarine, missing radioactive material, or a dirty bomb, potentially created by a terrorist cell. We think it’s unlikely that this is the work of an extraterrestrial intelligence. But we wouldn’t rule out the possibility of an intrusion by a foreign government. In our view, the greater risk to western civilization today is not the threat of a foreign attack, or an alien invasion, or even a new cold war. It’s the status quo. The business-as-usual approach to deficit spending with no end in sight. Left unchecked, this has the potential to wreak havoc on the U.S. financial system.

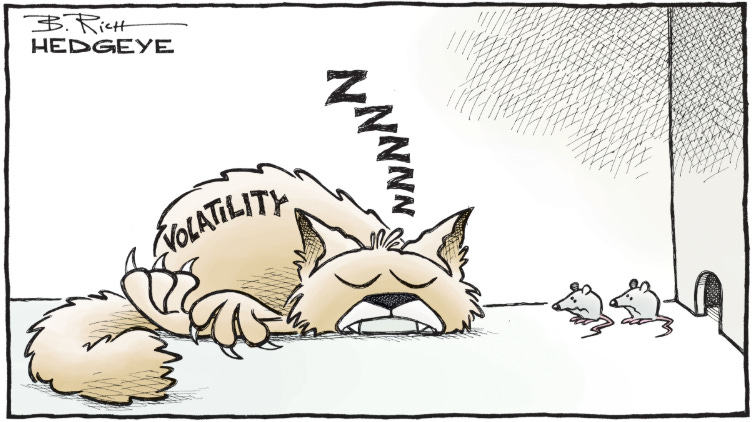
Notwithstanding periodic bouts of restlessness, volatility has remained in a relatively deep slumber for the past two years. Its absence has resulted in a pall of complacency that has now dulled the senses of investors and politicians alike. They are convinced that it will remain in permanent hibernation. It brings to mind a scene from the brilliant sci-fi film, Reign of Fire, when the childhood Quinn Abercromby, played by Christian Bale in adulthood, stumbles into a subterranean dragon nest while visiting his architect mother at a construction sight in London, circa 2084. As the dragon’s eye opens for the first time in over 1 million years, it becomes the lightswitch moment that changes the course of history for all of humanity. Volatility is like that sleeping dragon. It’s devastating effect on asset prices is forgotten while it lies dormant.
According to research conducted by Larry McDonald of the Bear Traps Report,
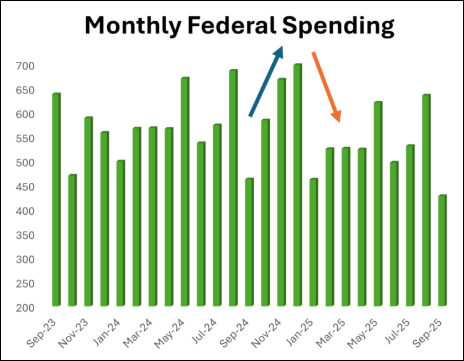
“The outgoing administration has opened the floodgates with spending to get every penny out the door while they can under the existing budget. It’s almost like they are looting the Treasury before they leave town. Spending for 2025 is expected to exceed $2T by the time Biden leaves DC on January 20th. This is over 30% of the annual budget, and Trump will have to cut spending for the rest of the year to stay within the limits of the allocated budget. This could mean a notable slowdown in GDP growth in the first quarters of 2025.”
Congress, in its infinite wisdom, has failed to agree on the next budget, so the government is currently operating under a “continuing resolution” (CR). This CR means the government is only allowed to spend the same amount of money they spent last year, which was $6.75 trillion. Since the government’s fiscal year started on October 1st, and Biden was on a run rate to spend almost $2 trillion by the end of December — 30% of the total allocated budget and a deficit exceeding $800 billion (+60% Y/Y) for the period, when the new administration arrives on January 20th, they will have been short-changed right out of the gate. Conservatively, we would project a 25% Q/Q decline in government spending during the first quarter of 2025 — or about $500 billion. Why is that bad? A $500 billion decline in government spending from Q4 to Q1 is the rough equivalent of a 1.7 percentage point decline in GDP growth. So, if nominal GDP is slated to grow at a 5.7% annualized rate in Q4, then it will likely fall to 4% in Q1. With the CPI still holding stubbornly close to 3%, that would put real GDP growth somewhere around a 1% annualized rate in Q1.
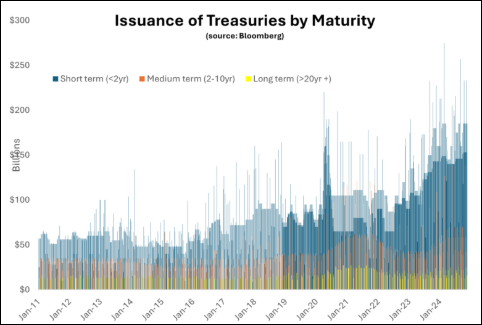
Moreover, the incoming Senate majority leader John Thune has made it abundantly clear that his priorities are immigration and energy legislation for 2025, leaving a fiscal spending bill likely a late-2025 or early-2026 reality. With that being said, the Treasury Department has come to rely on short-term bills to fund the government. But with over $36 trillion of debt now, the Treasury has to issue bills almost every day not just to keep funding the government, but also to refund its maturing debt. Interest payments on the national debt totalled $910 billion in fiscal 2024. With the average weighted coupon on the U.S. debt load at about 2.7% vs. over 4.5% for 10-year U.S. Treasuries today, as bonds mature, they get refinanced at much higher yields. By issuing nearly $10 trillion in short-term bills, Treasury Secretary Yellen succeeded in suppressing bond volatility in an election year and, in our view, strategically pushing that bond market volatility into 2025, post-election. Now, in 2025, this paper has to be rolled over and termed-out into longer-dated bonds. The Treasury’s reliance on short-term debt has exploded in recent years. The bond market has begun to take notice.
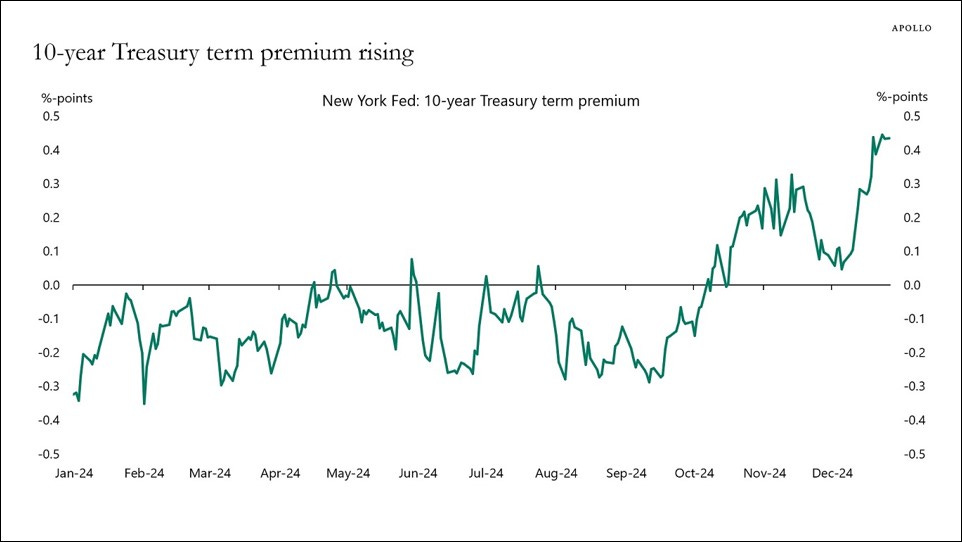
Total term debt in the U.S. has grown from about $19 trillion at the end of 2004 to around $72 trillion at the end of 2024. The largest component of that debt comes courtesy of the U.S. federal government, followed by corporations, and then mortgagees. These figures don’t include revolving credit lines, asset-backed bank loans, or BNPL installment loans. What is significant about this change is that the sheer magnitude of the increase in the underlying debt load means that a 1.0% increase in interest rates today has an entirely different, and far more negative impact on the balance sheets of institutions that own this debt. A move up to 6% on the 10-year Treasury today has the equivalent destructive capacity of a move up to 10% twenty years ago in terms of the dollar value of the implied loss in bond values. Given that the Reverse Repo Facility is now close to being depleted (less than $100 billion as of December 20th), it would stand to reason that incoming Treasury Secretary Scott Bessent may reduce bill issuance and extend the duration of outstanding U.S. debt by issuing longer-dated coupon bonds.

Once he does, it will be like that dragon opening its eye. That lightswitch moment that changes the course of history for bondholders, as the market realizes that 86% of the $9.6 trillion in maturing Treasury debt is in the form of short-term bills that may be termed-out. This could have significant knock-on effects with respect to putting pressure on bank balance sheets and the cost of capital for corporations issuing U.S. dollar-based debt. Conversely, according to Goldman Sachs, the Federal Reserve is expected to stop the run-off of Treasuries from its balance sheet by the end of January and begin buying Treasuries again with the proceeds of the maturing MBS on its balance sheet. This could potentially offset any pressure that Treasury issuance might have on the long-end of the yield curve. Although the positive swing is expected to be a mere $600 billion net, leaving $9 trillion still hanging in the balance.
Substack Community Spotlight
The Substack platform has grown into a hub for highly credible financial analysts and investment strategists to publish their insights and perspectives. High quality research and analysis, previously reserved only for institutions, is now available for public consumption. We thought that it might be helpful to our readers if we highlighted a few of the publications that we find to be of interest. Below are three newsletters from other independent thinkers that you might find interesting too:
Asbury Research Chart Focus: Emphasizing the key charts that illustrate the health and trajectory of the market.
Money Machine Newsletter: The red pill of stock picking service and research.
The Market Mosaic: Identifying trend-ready stocks.
Macro Perspectives: Back to the Nifty Fifty
In August of 2020, we penned a brief article that we posted on LinkedIn, which we entitled, Ex_Machina:
“Like the Nifty Fifty of the early 1970’s, investors have become infatuated with what we have dubbed the Fashionable Five: FB, AAPL, AMZN, MSFT, and GOOGL. Yes, these are just the FAAMG stocks, but the acronym doesn’t quite fit the analogy. What does fit the analogy is fact that during both periods, valuation was deemed unimportant, as the growth rates of the companies in question were perceived to be highly sustainable.
As such, investors believed that the stocks should simply be bought at any price because eventually the companies would grow into their valuations — and they were right! At their peak valuation in December of 1972, the Nifty Fifty traded at more than twice the P/E of the S&P 500 index. But, a buy and hold investor who purchased an equal-weight portfolio of the Nifty Fifty stocks at their peak actually outperformed the market on average over the next 25 years, compounding at >13% per annum.
How does this experience translate to investors today? Well, to put it into perspective, let's consider the current valuation of the Fashionable Five. A recent report from Strategas showed these five institutional darlings to be valued at a 50% premium to the market on a P/E basis. But accounting principles have changed a bit over the last 50 years, so maybe using price-to-sales (P/S) would give a clearer view. For example, AAPL, with a mkt cap of approximately $1.8T today, trades at 6.6x TTM revenues of $274B. By comparison, the S&P now trades at a P/S multiple of about 2.2x. That would suggest AAPL is trading at 3x the valuation of the market. It's the same or worse for the others, but you get the idea.
Oh yeah, and there's this other thing about the Nifty Fifty that we forgot to mention. Before they went on to compound at 13% annually for 25 years, the market first underwent a -48% drawdown from January 1973 through December 1974. During that period, some of the top names among the Nifty Fifty went on to post catastrophic declines. IBM lost -62%, KO was down -69%, XRX fell -71%, MCD careened -72%, AVP imploded by -86%, DIS toppled -87%, and Polaroid collapsed -91%, just to cite a few examples. Will the Fashionable Five follow in the footsteps of the Nifty Fifty? Stay tuned.”

We wanted to share that post with our readers again today, because its relevance has not changed. What has changed is the degree of overvaluation of the FAAMG stocks (more popularly known as the Magnificent Seven today when NVDA and TSLA are added to the mix). For example, with respect to AAPL, its market cap is now $3.79 trillion — more than double its 2020 level. But it also now trades at a P/S multiple of nearly 10x vs. 6.6x back in 2020. Today, the P/S ratio is about the same for META, but it’s 12.4x for MSFT, 14.5x for TSLA, and 29.5x for NVDA!
On December 29th, the esteemed veteran market technician Walter Deemer posted a few of his observations on X. He wrote:
“I’m becoming more and more concerned by how the market resembles 1972, when the Nifty 50 one-decision growth stocks, heavily-weighted in the averages, went up, but almost nothing else did. Because that one didn’t end well at all.
Why focus on the Nifty 50 and not the Dot-Com bubble in 2000? Because the Nifty 50 had earnings — past, present and future. Most Dot-Com stocks didn’t (MSFT, INTC, CSCO, and DELL — the so-called four horsemen of the Nasdaq at that time — actually did have earnings).
This is how “the market” looked in early 1973. Note the new all-time high in the averages and the massive non-confirmation by the advance-decline line.”

“And by early 1973 the unweighted averages were breaking down from bear market rallies. This is how I saw it at the time.
That 1972 episode is why I’m more and more concerned by the continued non-participation of the Russell 2000.
It seems to me there are just two alternatives: 1) The Russell 2000 finally joins the party; or 2) It keeps on ignoring the “strength” in the S&P 500. If the latter is the case, then I don’t see how the story can end well. The Russell 2000 chart may thus be the most important chart of all to watch here.
Also, there’s one huge difference between now and 1972: Speculative activity was virtually non-existent then (after boiling during the go-go years, 1968-69), but is running wild now. (See the most active lists/meme-coins). That’s not a positive, but when and where it becomes a negative is something else we’ll know only in the fullness of time.”

The advance-decline lines for both the S&P 500 and the NYSE Composite flashed similar, albeit less pronounced, negative divergences in early-December before careening lower with stock prices — just as they did in 1973. If Walter Deemer is correct — and he was there to witness the Nifty Fifty market first hand — then there’s a legitimate case to be made for a severe bear market to follow any meaningful decline in the Russell 2000 index that sustains below its 200-day SMA — and perhaps more importantly, its 200-week SMA.
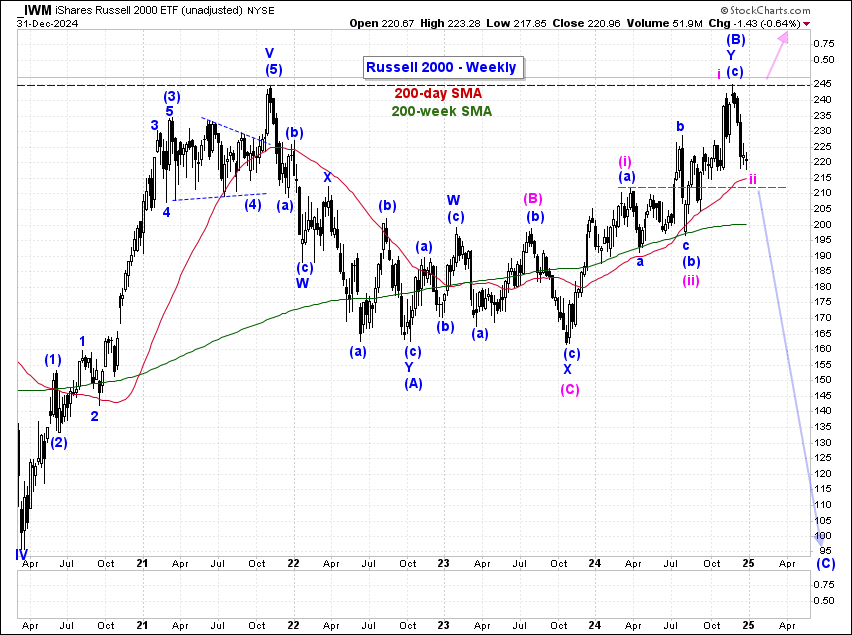
As illustrated in chart of the Russell 2000 index above, there are two potential Elliott Wave counts that appear to be at odds with one another. Our preferred count (blue) suggests that the choppy, overlapping advance off the October 2022 lows [W-X-Y] is countertrend and represents primary wave (B) of a potential “flat” corrective wave form at cycle degree. If so, then primary wave (C) down is now underway. The alternate count (magenta) suggests that the bear market in small cap stocks terminated in October 2023, and that the opening salvo of a new impulsive advance is subdividing at minor and minute degrees of trend [(i)-(ii), i-ii]. A breach of the two key moving averages discussed above would confirm our preferred count and open the gate to new bear market lows for the index. A new high in the index would confirm the alternate count and remove our immediate bearish concerns.
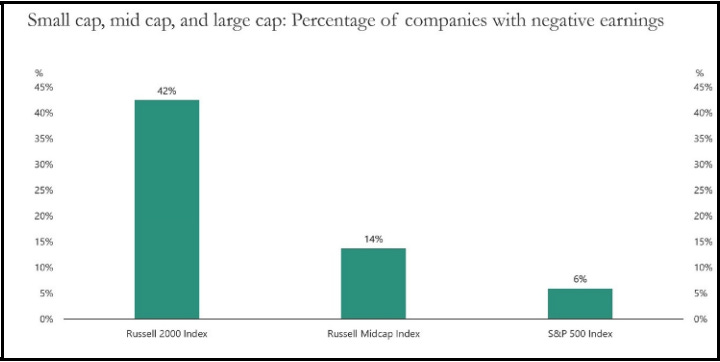
The fundamental problem that we have with the bull case for the Russell 2000 is that 42% of the companies that make up the index are expected to lose money in 2025. But