

HUGE INSIGHTS: The Big Picture - Issue #43
A Hard Rain's A-Gonna Fall

Please enjoy the free portion of this monthly investment newsletter with our compliments. To get full access, you may want to consider an upgrade to paid for as little as $15/month. As an added bonus, paid subscribers also receive our weekly ALPHA INSIGHTS: Idea Generator Lab report, an institutional publication that provides updated market analysis and details our top actionable ETF idea every Wednesday. Thanks for your interest in our work!

Executive Summary
The Paradoxical Irony of Markets
Macro Perspectives: The Paradox of Thrift
Geopolitics: Things That Make You Go…Hmmm
Market Analysis & Outlook: Casino Royale
Conclusions & Positioning: Ch-Ch-Ch-Ch-Changes
The Paradoxical Irony of Markets
The word “paradoxical” is derived from the root word paradox, which comes from the Greek words PARA — meaning “distinct from,” and DOXA — meaning “opinion.” It was originally articulated as PARADOXON — meaning “contrary opinion.” But by the mid-16th century, the Late Latin pronunciation evolved to PARADOX — denoting a statement that is “contrary to the accepted opinion.”
The word “irony,” derives from the Greek words EIRON — meaning “dissembler,” which became EIRONEIA — meaning “simulated ignorance.” The early-16th century Latin translation became IRONY — denoting Socratic iron, which was a literary technique originally used in Greek tragedy, whereby the full significance of a character’s words and actions are clear to the audience or reader although unknown to the character. It is more commonly used today as an expression of one’s meaning by using language that normally signifies the opposite, typically for humor or emphasis.
And despite what we are led to believe by singer-songwriter Alanis Morissette, “Rain on your wedding day” is not ironic. At best, it’s an unfortunate coincidence. Even the presumed literary genius Troy Dyer, a character played by actor Ethan Hawke in the Tim Burton comedy film Reality Bites, gets it wrong when he explains, “It’s when the actual meaning is the complete opposite of the literal meaning.”
A good example of paradoxical irony can be found in the opening monologue of the brilliant Taylor Sheridan television miniseries, 1883 — written in the classic fashion of a Greek tragedy. Here, Sheridan’s central character, the tragic heroine Elsa Dutton, a naive but optimistic 18-year old girl from Tennessee embarking upon an epic journey across the American frontier, narrates the story from the vantage point of her future self beyond the grave — as an experienced woman with the wisdom of Solomon. In the opening scene, as Lakota warriors attack her wagon train, Elsa’s thoughts are heard in VoiceOver:
“I remember the first time I saw it. Tried to find the words to describe it, but I couldn’t. Nothing had prepared me, no books, no teachers, not even my parents. I heard a thousand stories but none could describe this place. It must be witnessed to be understood. And yet, I’ve seen it, and understand it even less than before I first cast eyes on this place. Some call it the American Desert, others, the Great Plains. But those phrases were invented by professors at universities, surrounded by the illusion of order and the fantasy of right and wrong. To know it, you must walk it. Bleed into its dirt. Drown in its rivers. Then its name become clear. It is hell, and there are demons everywhere. But if this is hell, and I’m in it, then I must be a demon too. And I’m already dead.”
We did not choose this example because we want you to know that we are raving fans of the work of Taylor Sheridan (although we do consider him to be one of the best screenwriters in film and television today). No. We chose this example because it epitomizes the concept of paradoxical irony: An 18-year old, Christian female during the era of Manifest Destiny, who becomes a cowboy, a vigilante, the wife of a Native American, and ultimately a warrior; An optimist who expresses the sadness of Beethoven himself, as her fingers grace an abandoned piano to play Moonlight Sonata from memory, with the technical proficiency and musicality of a master; The conflict between her optimistic naiveté and the harsh reality of her experience; The story of the living told from the perspective of the dead. These are the characteristics of paradox combined with irony, thus producing an near enigmatic effect.

If you’ve been reading our monthly newsletter for a while, then you’ll know that the objective of our opening essay is to educate, elucidate, and elaborate upon a core idea that informs our view about the economy and the markets. Dues paying members of this club will also know that the idea that underscores our opening essay provides the foundation for our current investment thesis and market forecast, as well as our positioning recommendations.
Today’s market environment has been nothing short of a master class in paradoxical irony. While retail shoppers are famous for seeking the deepest price discounts before making large purchases, retail investors notoriously buy the most after stock prices have risen sharply and trade near their highest valuation extremes. Conversely, according to a recent Dalbar study, empirical data show those same retail investors sell the most after stock prices have declined sharply and trade near their lowest valuation extremes. This behavior has been observed over the years with such consistency that it has become a well-regarded contrarian buy-sell indicator.
Over the past four decades, with the help of computer models and decades of data, investor sentiment gauges have been devised from these prior anecdotal observations to more accurately measure the attitudes and positioning decisions of a variety of investor cohorts spanning not just individual retail investors (widely regarded as the dumb money), but also institutional asset allocators, professional money managers, hedge funds, commodity trading advisors, options traders, and broker-dealers (widely regarded as the smart money).

While not always a precise timing tool, as these sentiment measures move closer to optimistic extremes, it has proven advantageous, time and again, for investors to fade the consensus view and sell what is then considered most dear to the euphoric crowd. Reciprocally, when the investor sentiment reaches pessimistic extremes, it has historically benefitted investors to buy the stocks of high quality companies at depressed prices in the midst of panic selling. It is, of course, easier said than done.
You see, human beings are hard-wired to a “fight or flight” mechanism known as the amygdala — a small, almond-shaped region in the brain that plays a crucial role in processing emotions, particularly fear. It releases hormones such as adrenaline and cortisol, which regulate our response to danger. Unless a person has been conditioned to resist the natural response to run from danger, it is almost impossible for that person to take any other course of action unless cornered. Because this reality is not lost on Wall Street, they have taken measures to attempt to condition investors to resist panic selling. They create narratives to explain why the danger should be ignored, using positive trends in economic data and business fundamentals as evidence to support their optimistic expectations. And it generally works until a glaring deviation in the data convinces enough investors that the trend has changed.
Enter the economy. There is an amusing television commercial (wow, this guy watches a lot of TV…when does he find time to write?) where several adults are discussing how a Progressive Insurance product bundle will save a mother and her family hundreds of dollars. The mother responds, “Well, that’s nice, with the economy and all.” Her child then asks, “What’s the economy?” All of the adults in the room are at a loss to explain it. They finally end with, “What isn’t the economy?!” Just so we’re all on the same page — the economy is a complex system that encompasses all activities related to the production, distribution, trade, and consumption of goods and services within a specific region or nation.
By definition, it’s components can only be measured ex-post — meaning after the fact. But economists are notorious for extrapolating past data trends into the future — or ex-ante. The resulting economic forecast is always representative of the past trend and not the future. Why? Because the future is not yet known. It cannot be known. But as economic data is collected and aggregated, economists can get a good sense of how things are progressing with the goal of identifying changes in the trend. While still looking through the rearview mirror, it is a better approach than simply waiting for the final ex-post result to be announced by the official source.

The Atlanta Fed produces a widely observed Quarterly GDP Nowcast that attempts to forecast forward quarterly GDP growth by essentially updating the component inputs to the GDP computation with current data points as they are announced. Following an optimistic initial nowcast of nearly 4% annualized GDP growth for 1Q25, the subsequent data has proven consistently weaker than trend. After settling in at 2.3% GDP growth during the back half of February, the model’s most recent updates have completely derailed that assumption — first dropping the first quarter nowcast to -1.5% on February 28th, then to -2.8% on March 3rd. It has since ticked-up to -2.4% as of March 6th. Meanwhile, despite all evidence to the contrary, the Blue Chip consensus of the top economists on Wall Street remains confident that 1Q25 GDP growth will meet its steadily upwardly trending estimate of > 2.0%. Paradoxically ironic?
Macro Perspectives: The Paradox of Thrift
In 1936, John Maynard Keynes wrote a controversial book called, The General Theory of the Economy, in which he declared that spending and investment in the economy were the keys to increasing economic growth. He believed that the level of output and employment did not rely on the capacity of production, but rather on the decisions taken by individuals in society to spend and invest their money. Additionally, it was the role of the central bank to reduce interest rates and encourage greater investment. In congruence with spending in the economy, Keynes also said that saving money would reduce the amount of money that people spend and invest. The resulting loss of business would cause higher unemployment and eventually, lower economic growth. He called it the “Paradox of Thrift.”
Keynes did not view saving as its own entity, but rather as an excess of what is spent. Investment is the acquisition of capital goods. While consumption of goods and services helps increase national aggregate income, saving is just an element of income that leaked out of the circular flow of income.

He defined saving with the formula: S = Y(1–t) – C, where line I shows the relationship between investment spending and GDP, and line S shows the correlation between savings and GDP. When people wish to increase savings from S to S1, it leads to a fall in real investment and income from E to E1. That is, savings is a part of the income that is taken out of total consumption.
Perhaps a more practical way to understand the paradox of thrift, is to consider the fact that not spending equates to saving, reducing headcounts or not hiring equates to saving, and reducing debt also equates to saving. At the enterprise level, cost cutting, increased operational efficiency, and debt reduction, can lead to both greater profitability and a stronger balance sheet. But on a macro level, if every enterprise were to simultaneously engage in mass efforts to cut costs, streamline operations, and reduce debt, it would actually have the opposite effect. Because all businesses have input costs, overhead, and capital requirements, by shrinking these expenses all at once, it would result in lower production, lower sales, narrower margins, and lower capital investment to the detriment of most, if not all other businesses — and by extension, the economy at large. The result would be higher unemployment, lower aggregate income, and thus lower aggregate demand — but potentially higher fiscal deficits and an increased debt burden.
Enter D.O.G.E., the so-called Department of Government Efficiency. Regardless of whether or not it is legal or ethical, D.O.G.E. is a reality. Year to date, D.O.G.E. was responsible for eliminating 62,530 federal workers, a 41,311% increase compared to the same period during 2024. Indeed, the Challenger Report indicated that planned job cuts vaulted 245% to 172,017 last month, the highest level since July 2020, when the economy was in the grips of the COVID-19 pandemic. It was the highest February total since the Great Financial Crisis 16 years ago.

But D.O.G.E. isn’t just cutting federal jobs. The agency is also eliminating government contracts as it continues it mission of sniffing out alleged wasteful spending and corruption. This could lead to struggles from sectors and industries closely tied to the government, such as the aerospace and defense industry for example. This industry is also under threat as President Trump took an anti-war stance during his prior term and has sought peace between Russia and Ukraine during his current term. The Trump administration has also called for the Pentagon to reduce its spending budget by 8% in each of the next five years. In a statement he made from the Oval Office on February 13th, in the context of discussing a potential conference on defense-spending with China and Russia, President Trump said,
“When we straighten it all out, then one of the first meetings I want to have is with President Xi of China and President Putin of Russia, and I want to say let’s cut our military budget in half. And we can do that, and I think we’ll be able to do that.”
For fiscal year 2025, the United States defense budget is approximately $850 billion. The Pentagon has responded to Trump’s call by proposing cutting its budget by $50 billion a year in each of the next five years beginning in fiscal year 2026 — but has prioritized 17 areas from drones and submarines to military assistance for the southern border, as well as increased funding in the U.S. Indo-Pacific region. If the Pentagon succeeds in meeting Trump’s target, it will reduce spending by at least $750 billion over that planned period.
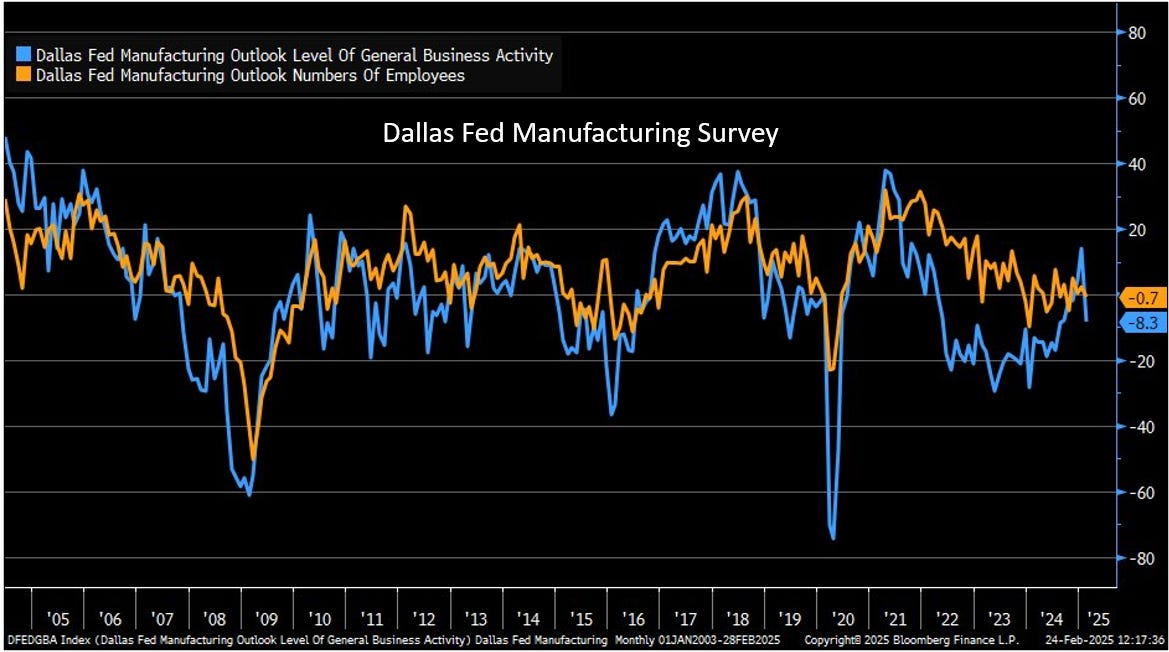
This will negatively affect aerospace and defense contractors across all fifty states, but especially key shipyards in states like Virginia, Washington, Maine, and Hawaii; and aircraft manufacturing facilities California, Washington, Texas, Connecticut, Arizona, Florida, Ohio, Kansas, Georgia, Virginia, Alabama, Colorado, Missouri, Maryland, New Hampshire, Maine, Utah, Kentucky, Arkansas, and West Virginia. Defense contractors are among these state’s largest employers. The potential collateral damage to state and local economies throughout the U.S. makes this proposition the poster child for the paradox of thrift. Moreover, the Dallas Fed’s Manufacturing Activity Outlook index plunged by 22 points in February to -8.3 after hitting a three-year high of 14.1 in January. Production also fell 21 points to -9.1 from 12.2 in the prior month, while employment slipped to -0.7 from 2.2 in January — and that’s before any actual cuts!
Another area of military cost cutting that has seen its fair share of critical press coverage in recent days is the list of now 585 contracts related to the Veterans Administration that are slated to be terminated by D.O.G.E. The key bone of contention being safety at the agency’s almost 1,400 hospitals and clinics. On March 5th, the VA announced that it would lay off 80,000 workers in an agencywide reorganization scheduled for August. According to a memo to VA employees, the aim is to reduce its workforce to the 2019 level of 400,000.
We could go on, but we’re sure that you get our point by now. The United States of America is not just another enterprise and cannot be run like one without unintended consequences and collateral damage. The government is just too big and too complex, and the country’s national interests extend well-beyond accounting ledgers, including and especially with respect to the health and welfare of its 335 million citizens. Not including the 1.3 million active-duty military personnel, the U.S. government is the largest employer in the nation with over 3 million federal civilian workers and an estimated 7 million contractors. If the goal of D.O.G.E. is to reduce the government workforce by 10% then that would put one million people out of work. According to ZipRecruiter, as of May 2024, the average annual pay for a government employee in the United States is $62,575, with the majority of salaries ranging between $45,000 and $75,500. Government contractors earn $90,984 per year on average, with top earners in a field making up to $131,000 annually, while those in the 25th percentile earn around $58,000 per year.
If we do the math, cutting a million jobs proportionally would save the U.S. government about $825 billion annually, before severance and early termination costs. If achieved, it would make a pretty big dent in the government’s estimated $1.9 trillion annual budget deficit for fiscal 2025. But it would also remove the same amount from aggregate income, and by extension from aggregate demand as well. According to renown Columbia University Professor of Economics Jeffrey Sachs, the combination of tariffs, cost cutting, and fiscal restraint alone simply won’t be enough to solve the nation’s budget problems. In a recent Thoughtful Money interview, Sachs shared that he has run the numbers and believes that the nation’s finances are in such dire straits at present that tax increases will be necessary at some point in the not too distant future. Yet, Sachs remains optimistic about the future for the U.S. — but only if it can get its fiscal house in order. He also believes the country needs to develop a long-term plan to invest aggressively in clean power and high-speed rail transportation infrastructure over the next twenty years if it wants to remain competitive with China.
No one wants to see tax increases — least of all the Republican majority in congress. The idea that tariffs can someday replace the need for an income tax is the current administration’s utopian dream. But total U.S. imports for 2024 were valued at $4.1 trillion, or just 14.2% of GDP. The current U.S. spending budget for fiscal 2025 is $7.3 trillion. Assuming a 25% across the board tariff on all imported goods into the U.S. would require imports to grow to $28 trillion, or 95% of 2024 GDP, if it is to replace the income tax and bring the deficit back to around 4% of GDP. It’s just a nonstarter.
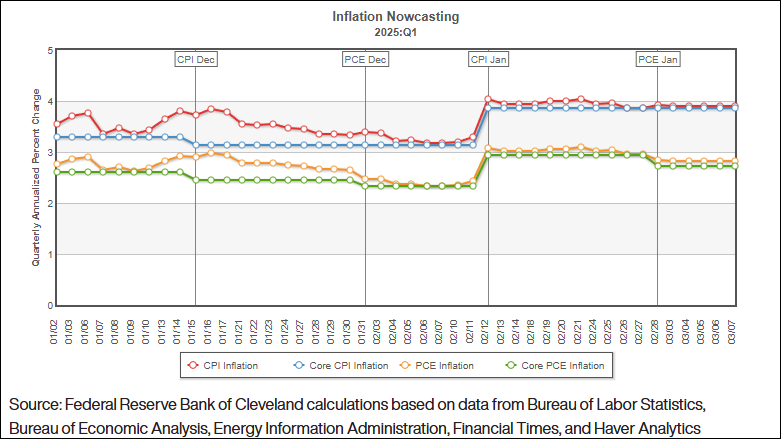
Moreover, inflation remains sticky with the CPI holding stubbornly close to 4%, while the PCE remains just below 3% despite showing some modest improvements in January. Tariffs will not improve the inflation picture. They will pressure supply chains across myriad industries and in some cases will provoke a retaliatory response that has the potential to hamstring a variety of prominent American businesses. From avocados to zinc, prices are poised to increase due to the taxing effect of tariffs and the disincentive to distribute products to the U.S. To quote Warren Buffett, from a recent CBS News interview:
“Tariffs are actually — we’ve had a lot of experience with them — they’re an act of war, to some degree. Over time, they are a tax on goods. I mean, the tooth fairy doesn’t pay ’em! And then what? You always have to ask that question in economics. You always say, ‘And then what?’”
We’re asking, and so far, we don’t like the answer. We doubt investors will either.

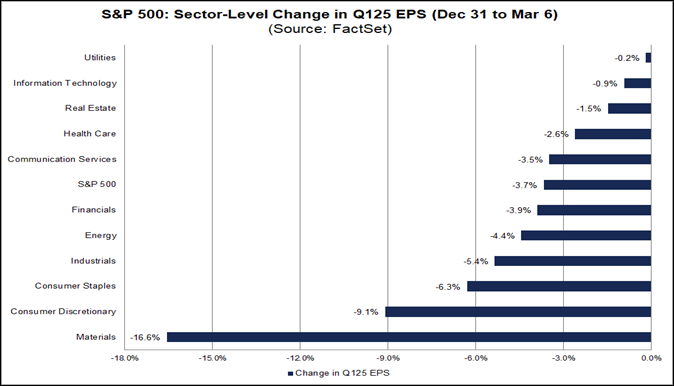
Indeed, after reviewing transcripts from earnings calls conducted from December 15th through March 6th, FactSet Research found that some 259 companies within the S&P 500 cited “tariffs” as a key risk to hitting revenue and EPS targets this year. That’s the highest number on record over the past decade — exceeding the prior record of 185 companies back in 2018. It’s interesting to note that the four sectors that have the highest percentages of companies citing tariffs — Materials, Industrials, Consumer Discretionary, and Consumer Staples — are also the four sectors that have seen the largest cuts to EPS estimates for Q1 to date.
Substack Community Spotlight
The Substack platform has grown into a hub for highly credible financial analysts and investment strategists to publish their insights and perspectives. High quality research and analysis, previously reserved only for institutions, is now available for public consumption. As such, we thought that it might be helpful to our readers if we highlighted a few of the publications that we find to be of interest. Below are three newsletters from other independent thinkers that you might find interesting too:
Asbury Research Chart Focus: Emphasizing the key charts that illustrate the health and trajectory of the market.
The Weekly S&P 500 #ChartStorm: Carefully hand picked charts with clear commentary on why they matter and how they fit together.
The Tri Polar World by Jay Pelosky: A unique take on global macro investing developed through 35 years of day in and day out work in global financial markets.
Geopolitics: Things That Make You Go…Hmmm
Normally in this section we like to highlight unusual geopolitical events in order to shed some light on how we might best interpret their impact upon the markets. But there are so many unusual geopolitical events today, and things are changing so fast, that by the time we’re able to synthesize the necessary information in order to formulate a conclusion, the narrative has completely changed — making our efforts somewhat futile for the time being. So, in lieu of another erudite think piece on geopolitics, we thought we would just share with our readers one of the more interesting concepts that has materialized in our ongoing big picture research project.
The “Cycle of Civilization” graphic below was produced by Michael Haupt of Roam Research. It represents a point of view that is heavily informed by independent research and study, the details of which are available below:

Market Analysis & Outlook: Casino Royale
The S&P 500 index is now down 1.7% for the year. Precious metals continue to dominate all equity markets year-to-date, led by silver (+12.2%), with gold a close second (+10.3%). Conversely, bitcoin has completely reversed its prior gains and is now down 6.8% for the year. Foreign stocks (+9.1%) remain the leadership among global equities, while U.S. small-caps (-6.6%) are lagging the pack. NVIDIA just reported its 4Q24 results on February 26th. It was another beat-and-raise quarter. But growth is clearly slowing and the stock is down 16.1% for the year. Indeed, the entire Magnificent Seven complex is down by 10.2% year-to-date on average – with Meta Platforms the sole winner (+6.9%), and Tesla the standout loser (-35%). All in, about 64% of S&P 500 issues are now outperforming the benchmark index year-to-date with 19% up double digits, while a full 41% are in negative territory for the year.

Bitcoin Update
Last month we discussed the limits of our affinity towards bitcoin. While we had been ardent bulls on the price of bitcoin since last May, and became even more bullish following President Trump’s decisive victory last Fall, the recent price action in the senior crypto-asset appears to have traced out a classic patterned top formation of the