

HUGE INSIGHTS: The Big Picture - Issue #45
Schrödinger's Box

Please enjoy the free portion of this monthly investment newsletter with our compliments. To get full access, you may want to consider an upgrade to paid for as little as $15/month. As an added bonus, paid subscribers also receive our weekly ALPHA INSIGHTS: Idea Generator Lab report, an institutional publication that provides updated market analysis and details our top actionable ETF idea every Wednesday. Thanks for your interest in our work!

Executive Summary
Are We Approaching a Minsky Moment?
Macro Perspectives: Why Stock Markets Crash
Geopolitics: Trade War — What is it Good For?
Market Analysis & Outlook: Look Out Below!
Conclusions & Positioning: Capital Preservation
Are We Approaching a Minsky Moment?
In quantum mechanics, Schrödinger’s Box, also known as Schrödinger’s Cat, is a thought experiment concerning quantum superposition. It was devised by physicist Erwin Schrödinger in 1935 in a correspondence with Albert Einstein to illustrate what Schrödinger saw as the problem with the Copenhagen interpretation of quantum mechanics. In the thought experiment, a hypothetical cat placed in a closed box may be considered to be simultaneously both alive and dead while it is unobserved, as a result of its fate being linked to a random subatomic event that may or may not occur.
Schrödinger wrote:
“One can devise even completely farcical cases:
A cat is put into a steel chamber along with the following infernal device: in a Geiger counter, there is a tiny amount of radioactive substance, so tiny that in the course of an hour one of the atoms will perhaps decay, but also, with equal probability, none of them will; if it does happen, the counter tube will discharge and through a relay, release a hammer that will shatter a small flask of hydrocyanic acid. If one has left this entire system to itself for an hour, one would tell oneself that the cat is still alive if no atom has decayed in the meantime. But, even a single atomic decay would have poisoned it. The psi-function of the entire system would express this by having in it the living and dead cat (pardon the expression) mixed or spread out in equal parts.
It is typical of these cases that an indeterminacy originally restricted to the atomic domain turns into an observable indeterminacy, which can then be resolved by direct observation. This prevents us from so naively accepting a “blurred model” as representative of reality.”
The Copenhagen interpretation, a term coined by physicist Werner Heisenberg, implies that the cat is therefore simultaneously alive and dead. Yet, when one looks in the box, one sees the cat either alive or dead, not both alive and dead. This poses the question of when exactly quantum superposition ends and reality resolves into one possibility or the other.

Given today’s circumstances, we can think about the stock market in a similar way. For example, consider the stock market as the cat. The stock market is either alive (in a bull market), or dead (in a bear market). It cannot be both. The steel box is the range between the 200-DMA and the April 7th low. As long as the stock market remains in that range, the box remains sealed. A good metaphor for a radioactive agent might be the 10-year U.S. Treasury yield. If the yield rises above a certain upper threshold, it’s like poison for the stock market. But, if it falls below a certain lower threshold, it’s like oxygen. And while we can hypothesize as to what those levels are (or if they even matter at all), we cannot know for certain whether the stock market is alive or dead until we open the box — that is to say, until the market breaks sustainably above or below the range. Which ever condition we ultimately observe will resolve the state of our reality.

But what might cause the 10-year Treasury yield to move in one direction or the other? One possibility is that the Federal Reserve could intervene — remember QE and QT? President Trump has already insisted (more than once) that the Fed needs to cut rates. Another possibility is that the Treasury department could intervene. Leading up to the election, former-Treasury secretary Janet Yellen notoriously funded the government by issuing debt at the short end of the curve — to the detriment of long-term bondholders. Conversely, Scott Bessent, the new Treasury secretary, has been quite vocal about the need for the government to term-out the national debt. If he follows through on his rhetoric — with some $10 trillion in U.S. government debt maturing in the coming months — that too could put significant pressure on 10-year Treasury yields.

Trump’s trade policy is a strong example of how even “negotiations” can adversely affect the stability of the global financial system. To be sure, the 10-year Treasury Yield and the U.S. Dollar index (USD) have maintained a rather tight correlation over the past two years. But in recent weeks, that correlation has decoupled. As one might suspect, this is likely related to trade tensions. Evidence suggests that there has been a re-rating of the “safe haven” status of the U.S. by global market forces. A rush by foreign investors to repatriate capital before tariffs go into full-effect has been underway since the April 2nd reciprocal tariff announcement. This triggered a surge in the MOVE index, a measure of Treasury market volatility, which spiked to its highest level in three years — reaching 138%. Meanwhile, the USD careened lower even as 10-year Treasury yields vaulted by more than 50 basis points to the upside.

The uncertainty principle, another fundamental concept in quantum mechanics first introduced by Heisenberg in 1927, states that there’s a limit to the precision with which certain pairs of physical properties, such as position and momentum, can be simultaneously known. In other words, the more accurately one property is measured, the less accurately the other property can be known. The USD now appears precariously positioned below both its 200-day EMA and its 200-week SMA, and has recently broken below a three-year shelf of support with strong downward momentum. Long-term trend support (not shown) comes into play at about 97. A sustained breach of that level would confirm a measured move to approximately 89, then 85 — or some 10-15% lower. Will the USD’s year-to-date trend extend lower, or will a 3AM “Truth” from the President result in another abrupt reversal?

It remains to be seen, but past surges in the MOVE index have sometimes coincided with major trend changes in the 10-year Treasury yield. The set-up coming into April was that of a potential classic patterned top formation of the “Head & Shoulders” variety (annotated in red). It appeared to have already resolved to the downside, thus carrying the yield substantially below the neckline. But that pattern failed and the yield reversed sharply in the opposite direction. The conclusion now is that a “bull flag” may have instead resolved to the upside. If correct, then an “equal-swings” move would target a higher yield of approximately 4.85% on the 10-year T-Note. There is nothing more bullish than a failed bearish pattern, but a decline below 3.88% would invalidate the bull flag and leave the pattern open to interpretation.
Another potential reason that has been posited to explain the extreme volatility in the bond market last month, is the unwinding of the so-called “basis trade.” The basis is the difference in price between a Treasury security and a Treasury futures contract with similar characteristics. The source of this price difference comes from either supply-demand imbalances in Treasury markets, or sometimes arbitrage limitations that exist due to regulatory issues. To capitalize on the basis spread, hedge funds put on leveraged bets, sometimes up to 100 times the value of their principal, with the goal of profiting from the convergence between the futures price and the bond price, as the futures contract approaches expiry. How big is the basis trade? It was estimated to be around $800 billion going into April and it represented an important part of the $2 trillion in then outstanding prime brokerage balances. The trouble is, regardless of the recent volatility, it will probably continue to expand as U.S. government debt levels grow.
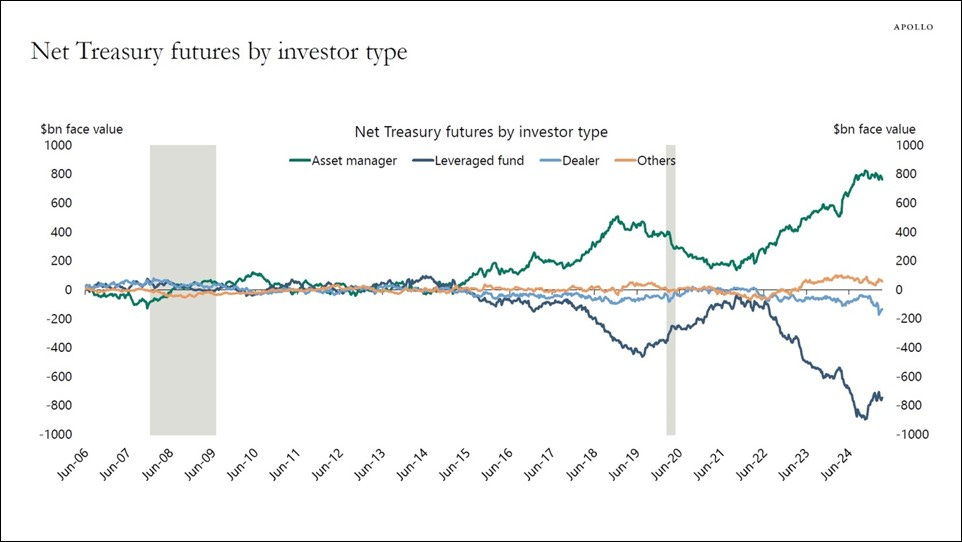
Why is this a problem? Because the cash-futures basis trade is another potential source of Treasury market instability. In the event of an exogenous shock, the highly leveraged long positions in cash Treasury securities held by hedge funds are at risk of being rapidly unwound. Such an unwind would have to be absorbed, in the short run, by a broker-dealer — that is itself capital-constrained. This could lead to a significant disruption in the market function of broker-dealer firms, such as providing liquidity to the secondary market for Treasuries and intermediating the market for repo borrowing and lending. This happened during the global pandemic. At the peak of the crisis, the Fed was forced to buy $100 billion in Treasuries every day!

In addition, if the supply of Treasuries grows further, for example, because of a growing budget deficit or the Fed engaging in quantitative tightening, it could potentially depress Treasury prices, thus impairing the long leg of the trade, and putting undue stress on the market for repo funding, as dealers have limited balance sheet capacity. At the end of the day, the large and growing cash-futures basis trade, driven by leveraged hedge fund positions in Treasuries, poses a significant risk to the global financial system due to its potential market disruptions and liquidity issues, especially in the event of an exogenous shock or increasing Treasury supply. This brings us to the credit cycle, which in our view, is getting long in the tooth.

According to the post-Keynesian economist Hyman Minsky, there are three types of borrowers: The “hedge borrower” is one who can cover debt payments (both interest and principal) from current operating cash flows. This best describes the investment grade corporate debt market. Next there is the “speculative borrower,” whose cash flow from operations can only service the debt (covering the interest due), but the borrower must regularly roll over, or refinance, the principal. This best describes the public debt markets. Then there is the “Ponzi borrower.” This cohort borrows based upon the belief that future appreciation of the value of the collateral asset will be sufficient to refinance the debt, but cannot make sufficient payments of interest or principal with the cash flow from these investments; only the appreciating asset value can keep the Ponzi borrower afloat. This dynamic best describes the consumer debt market — specifically, with respect to risk assets including real estate and securities. But here’s the problem: risk asset prices are no longer appreciating. So, now what?
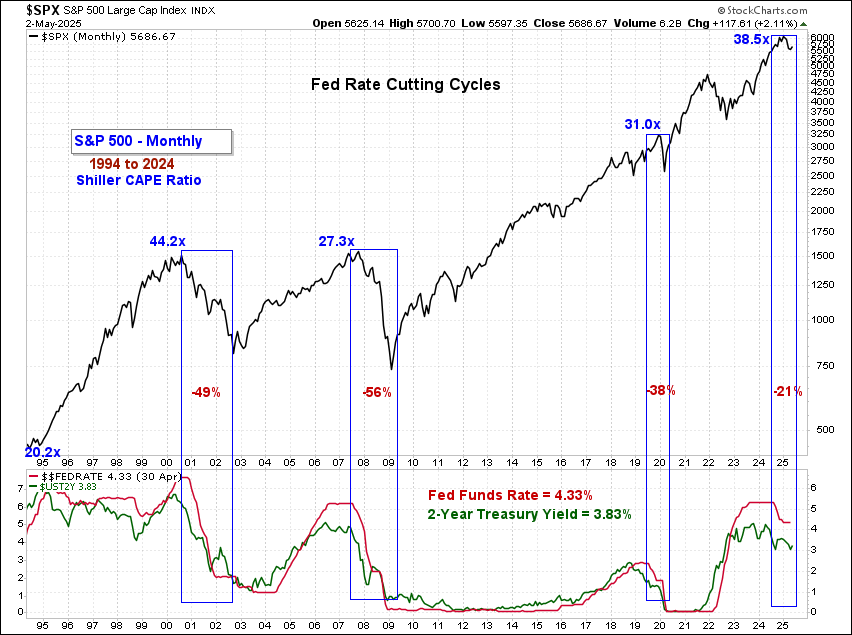
Will the Fed Come to the Rescue? According to our friend and former colleague Jim Paulsen — a fellow Leuthold Group alum, following the S&P 500’s 9.3% 2-day decline during the first week of April, the odds are quite high that the Fed will soon ease. As illustrated in the chart below, since 1965, a 2-day decline of such magnitude has only occurred on seven other occasions — once in 1987, three times during 2008, and three times in 2020. In every instance, the Federal Reserve almost instantly eased the Fed Funds rate. Jim suggests that if they don't ease, it will be unprecedented. We don’t disagree with Jim, but we do think that the Fed will be fashionably late — as per usual. The real question isn’t whether or not they’ll ease — it’s, will it work this time?

Indeed, the 2-year Treasury is already pricing in at least another 50 basis point rate cut this year. As we’ve written many times, the Federal Reserve does not make monetary policy — the market does. The Fed simply enforces it. For at least the last 30-years, directional changes in the 2-year Treasury yield have led changes to the Fed’s policy rate in the same direction by several months. Some may say that the market is simply anticipating what the Fed is likely to do. Possibly. But, in our view, it is more likely that the Fed takes its cues from the market. Why else would they send out dozens of Fed officials to make speeches to the market week after week other than to see what the market’s response is to the message before any action is taken? It brings to mind the old adage: What came first the chicken or the egg? Perhaps we’ll just have to accept the mystery.
One possible monkey wrench in the timing of the next Fed policy intervention is the consistently strong employment data. The U.S. economy added 177,000 jobs in April 2025, a slowdown from the downwardly revised 185,000 in March, but significantly surpassing market expectations of 130,000. This figure aligns closely with the average monthly gain of 152,000 over the past 12 months, despite growing uncertainty surrounding President Donald Trump’s aggressive tariff policies. Indeed, the unemployment rate was unchanged and has remained at or below 4.2% for the last 12-months through April. Other than the Fed’s half-point rate cut following the September 2024 FOMC meeting, there is just no precedent for aggressive monetary policy easing when the unemployment rate has been this low — and stable.

Below we’ll discuss why we think the risk of recession is rising, and what that might mean for earnings in the back half of the year. We will also discuss why we think the current state of stagflation may devolve into deflation, not inflation. In addition, we’ll examine the implications of Trump’s global trade policy on U.S. supply chains and how inventories could become depleted within a matter of months. Finally, we discuss our analysis of the equity markets, rates, commodities, currency, and crypto, then review our “Perfect Portfolio” asset allocation strategy (+6.9% YTD through 4/30/25), which details how we believe investors should be positioned today in order to thrive during what promises to be a period of sustained volatility in the months ahead.
Let’s begin…