

HUGE INSIGHTS: The Big Picture - Issue #35
Dow 100,000 or Bust

Please enjoy the free portion of this monthly newsletter with our compliments. To get full access, you might want to consider an upgrade to paid for as little as $15/month. As an added bonus, paid subscribers also receive our weekly ALPHA INSIGHTS: Idea Generator Lab publication, which details our top actionable trade idea and provides updated market analysis every Wednesday, as well as other random perks, including periodic ALPHA INSIGHTS: Interim Bulletin reports and exclusive video content.
Executive Summary
The Piper at the Gates of Dawn
A Saucerful of Secrets
Geopolitical Perspectives: Dark Side of the Moon
Market Analysis & Outlook: The Wall
Conclusions & Positioning: The Final Cut
Special Offer: Only for Paid Newsletter Subscribers
The Piper at the Gates of Dawn
On September 30, 1999, Prentice Hall announced the publication of the wildly optimistic investment book, Dow 100,000: Fact or Fiction, written by Charles W. Kadlec, the now retired Chief Investment Strategist for Seligman Funds. Therein, Kadlec laid out his case for the DJIA to rise ten-fold over the next 20-years from its then current level of 10,336 to what remains an unimaginable level of 100,000 by the year 2020. It was cheered by several notable figures in the financial and political communities including, Steve Forbes — Chairman of Forbes Magazine, the late Byron Wien — then Morgan Stanley’s Chief Investment Strategist, Stanford Professor Dr. Arthur Laffer — of “Laffer Curve” fame, the late Jack Kemp — a former Republican Congressman and one-time Presidential candidate, and our long-time friend Ralph Acampora — retired Chief Market Strategist for Prudential Securities — who wrote the book’s Foreword.
Not to be outdone, the very next day, on October 1, 1999, Crown Business Books announced the publication of their more conservatively titled, Dow 36,000: The New Strategy for Profiting from the Coming Rise in the Stock Market, by economist James Glassman and former Trump economic advisor Kevin Hassett. While Glassman’s and Hassett’s forecast might appear more reasonable given that the DJIA has since hit the 40,000 mark, it did in fact take about 20-years longer to achieve that target than the authors’ originally forecast. Both of these tomes were published less than six months before the top tick of the tech bubble, which was promptly followed by a 38% decline in the DJIA and an 78% decline in the Nasdaq 100 over the subsequent 33-months. As Warren Buffett once famously put it, “A bull market is like sex. It feels best just before it ends.”
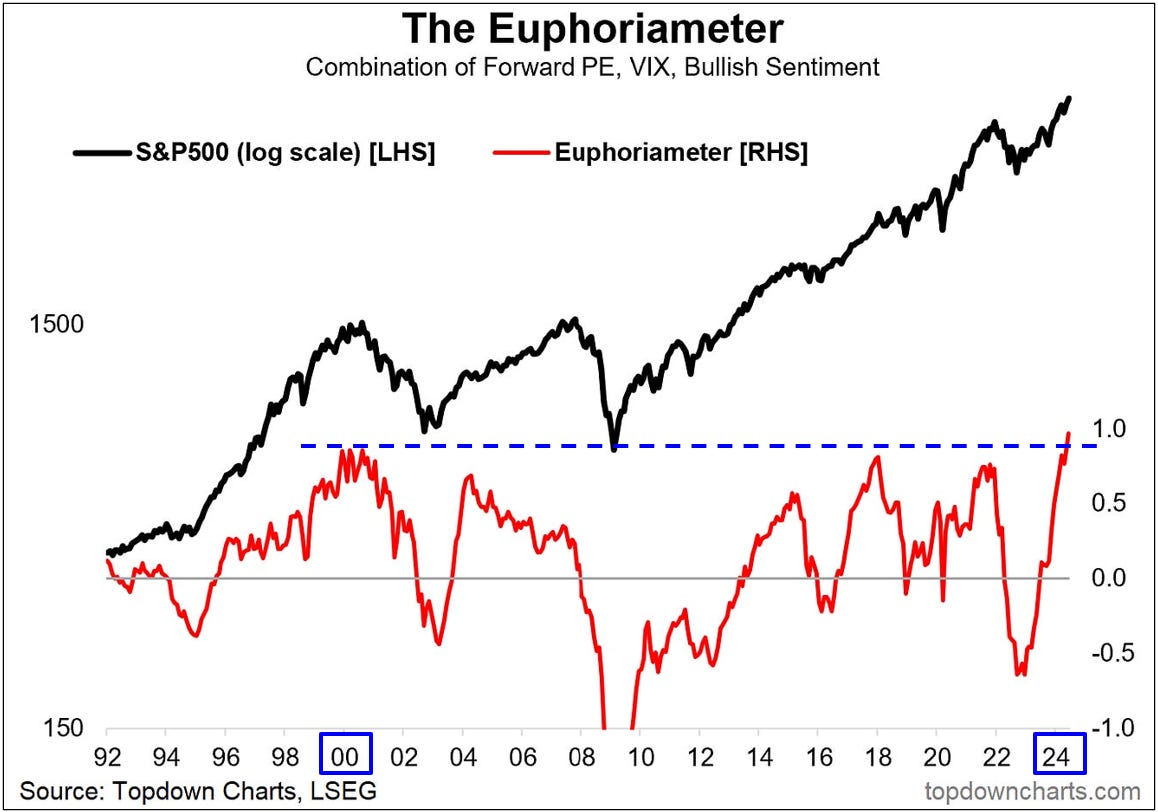
According to Euphoriameter, a model created by our friend Callum Thomas of Top Down Charts that combines key valuation, volatility, and investor sentiment measures, the current level of euphoria toward stocks now exceeds that of the Dot-Com era. While no two periods of market history are identical, the weight of the evidence that we lay out below suggests that at best the U.S. stock market is putting in a major top, and at worst it’s setting-up for a crash.
While both of the aforementioned books ultimately proved to be far too optimistic, if not complete works of fiction, they actually did serve a useful purpose. They acted as a warning light to anyone who had remained grounded in the fundamental realities of finance, in that they provided the necessary contrarian signal that many experienced investors had been looking for in order to begin the countdown to the inevitable end of the bull market. The books themselves simply documented the bull narrative, but their publication made every conceivable positive factor that could affect the outcome favorably much more widely-known, and left little in the way of upside surprises for the last round of investors to pile in at the market’s top in the first quarter of 2000.
One example of this is the bullish argument cited by Kadlec in Dow 100,000, whereby he extrapolated the growth in government tax receipts collected in 1998 out a full-decade into the future to arrive at a forecasted cumulative $5.3 trillion budget surplus by 2008. He reasoned at the time that declining inflation, falling interest rates, and accelerating GDP growth — “driven by productivity improvements realized from the paradigm shift toward a new technology-centric economy” — would lead to a sustained trend of growing annual budget surpluses reaching into the hundreds of billions of dollars annually. Sound familiar? The lessons of history are being abruptly discarded.
Another example argued by Kadlec in support of his bullish conclusion was for the continuation of improvements in foreign trade policy, especially between the U.S. and China. Kadlec cited Adam Smith’s Wealth of Nations extensively to establish the virtuous link between free-trade and prosperity. He then observed that China’s joining the World Trade Organization would extend the “rule of law” to matters of trade between China and the rest of the world. This, he opined, would lead to increased competition and eventually lower U.S. tariffs on goods imported from China. He also argued that integrating China more deeply into the world trading system would reduce the risks of future military conflicts between China and the U.S. To quote Robert Burns, “The best-laid schemes of mice and men gang aft agley.”
While it is unlikely that we will see a new book title published anytime soon that rivals the incredulity of Dow 100,000 — especially given how poorly history has judged it, and the many others that emerged toward the end of the Dot-Com era — risk averse investors would still do well to pay attention to the less permanent mediums that are often used to express such wild optimism with respect to stock prices. The latest issue of Barron’s would be a good place to start. As the cover below so aptly illustrates, some day-traders are watching their account balances double, or get cut-in-half, based upon a single day’s price action, by buying the securitized equivalent of a lottery ticket.
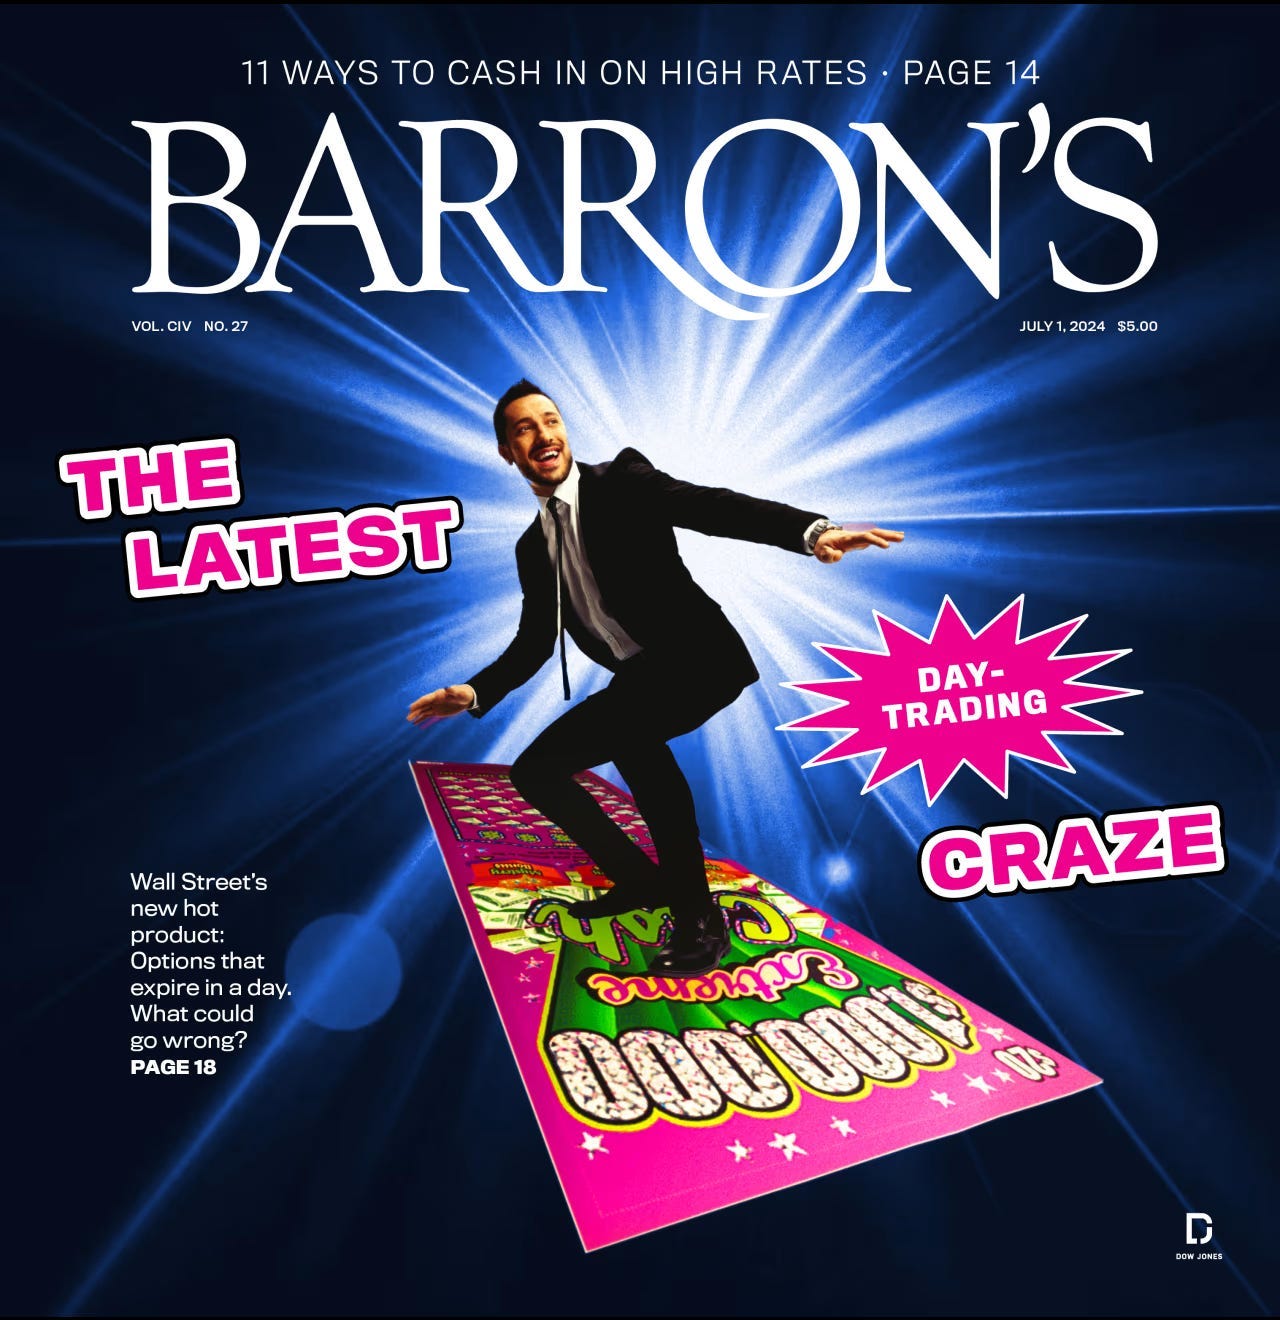
A new trend among the so-called “degen” traders — a self-deprecating identity that can be traced back to the term “degenerate gambler” — is to make outsized single stock bets using zero-days to expiration options (0DTE). This cohort revels in the practice of making long-shot bets that “proudly have nothing to do with conventional ways of assessing investments,” according to a recent Wall Street Journal article. The Barron’s cover story, features the headline, “Traders Are Flocking to Risky Zero-Dated Options. ‘You Can Go Completely Broke.’” The article details some of the trials and tribulations faced by various day traders. Here’s one example:
“Jin Wang has taken some wild rides as a day trader. A software product manager in Houston, he says he turned $26,200 into $73,000 one day in November 2022. On another day, he lost $20,000.”
Many of these long-shot bets have been tied to “meme” stocks like GameStop and AMC, which has helped to drive average daily volumes in options to a record 47 million contracts. Indeed, as of mid-June, Total Small Trader’s Net Long positioning rose to a new all-time high of $69.8 billion — 65% above the September 2021 extreme.
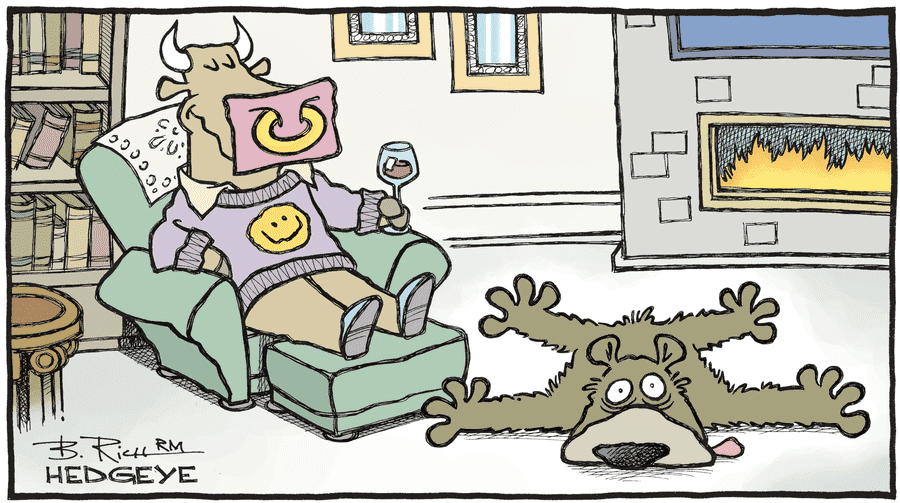
Trading in options can have one of only two possible motivations: hedging or speculation. Speculation is just another word for gambling. When gambling in the stock market using 0DTE options drives new volume records it has become nothing short of a “herding” behavior. Herding in the stock market is driven by emotions — specifically, the emotion of fear and desperation — fear of missing out (FOMO) in this case. FOMO is also responsible for the overconcentration in the S&P 500 index with now 31% of its market-cap in just six companies (MSFT, NVDA, AAPL, GOOG, AMZN, META). We’ve read a number of forecasts in recent weeks that predict the shares of fabless chip designer Nvidia will be worth $6 trillion by YE 2025. That rings of Dow 100,000 to us. As we ponder the possibility of such an outcome, a line from the film Moneyball comes to mind. “I think you’re forgetting one thing Billy,” Ron Washington (Brent Jennings) says to Billy Beane (Brad Pitt), as the group of baseball scouts react to the idea of recreating Jason Giambi in the aggregate by signing three mispriced, low-budget players who add up to Giambi statistically, “None of those three guys knows how to play first base.”
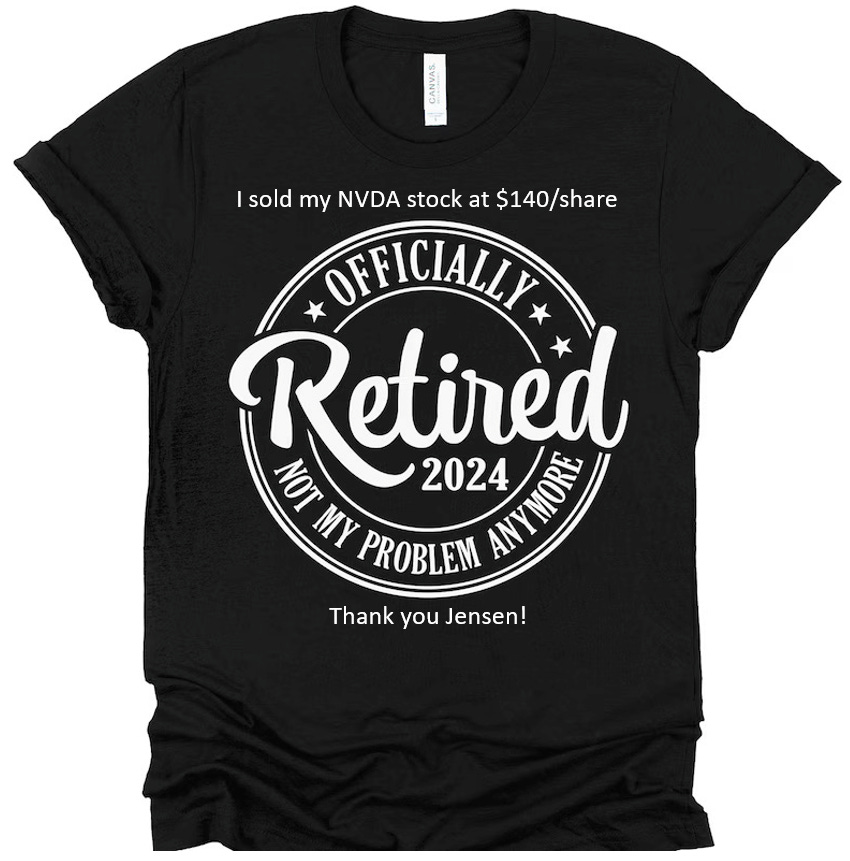
While Billy Beane got lucky when he put the throwing-impaired former catcher Scott Hatteberg at first base, the thing that investors seem to be forgetting with respect to Nvidia is that it’s a semiconductor company. The semiconductor business is perhaps the most cyclical business on the planet. Cycles can be short. Double and triple ordering plagues the industry during periods of tight supply. Inventories are often overbuilt as a result, and then later sent to the crusher when orders are canceled. Competition is stiff in the semiconductor industry, and there are relatively low barriers to entry for fabless chip design companies. As such, margins can get squeezed. Also, the assets go up and down the elevator every day. Those assets are people who get compensated with stock. When the value of a stock quintuples in a very short period of time — as is the case with NVDA shares — those people can get distracted. Some of the top people could even decide that it might be better to retire early with $25 million in the bank and just say, “not my problem anymore,” than it would be to slave away for another twenty years just to see how much richer they can get. Not everybody is as lucky as Billy Beane.
What seems most askew to us with respect to the current investment environment, is the degree of confidence that people are expressing toward the stock market with their actions, not just their words. There are many ways to illustrate this, but none better than the Speculative/Conservative ratio developed by Stock Market Cycles founder Peter Eliades, a man who has been successfully identifying major tops and bottoms in the stock market for nearly 50 years. The ratio, which looks at the Nasdaq Composite relative to the DJUA, just posted a new all-time record high on July 5th. It suggests that the demand for the most speculative stocks relative to the most conservative stocks in the broad U.S. stock market has never been higher.

We’ve been doing this for 34 years now and have only once ever encountered a similar environment, whereby investors literally acted as though they were impervious to harm. That was the first quarter of 2000. While the ratio did slightly exceed its March 2000 extreme in November 2021, investors did not exude the same level of unbridled confidence then that they did in March 2000. But today, once again, investors act as though they’ve seen everything, and somehow know with the highest degree of certainty, that this “new bull market” has a long way to go. And it’s not just stocks, but real estate, crypto, collectables, etc. It appears that investors will buy almost anything with the expectation that they can always sell it to a greater fool, at a higher price, at some point in the future. Some people like to use the term “bubble” to describe this condition. For us, the word “mania” seems more fitting.
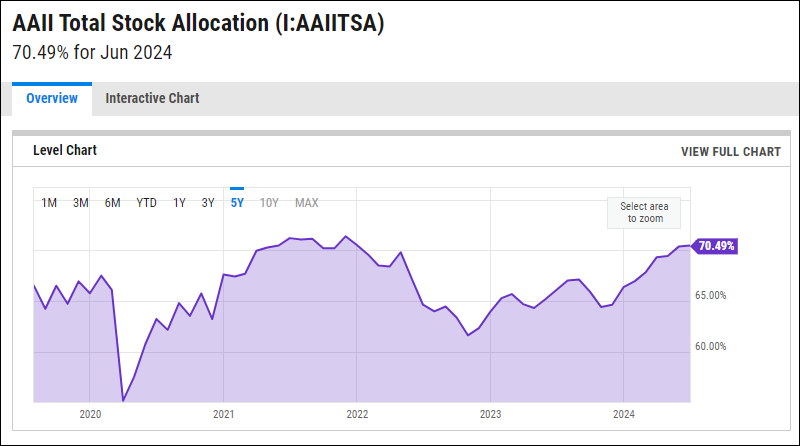
One gauge that helps to put things into perspective is the American Association of Individual Investors (AAII) Total Stock Allocation for the month ended June 2024. The number rarely exceeds 70% for this notoriously conservative cohort, and has averaged just 61.18% since 1987. It has only deviated by more than eleven percentage points above that level on one occasion — you guessed it — the month ended March 2000. Then it reached 72.31%. Today it’s 70.49% — less than two percentage point below the all-time record high, and less than one percentage point below the November 2021 high of 71.39%. Recall that the Nasdaq 100 made its prior cycle high that very month before plunging more than 38% to its October 2022 low.
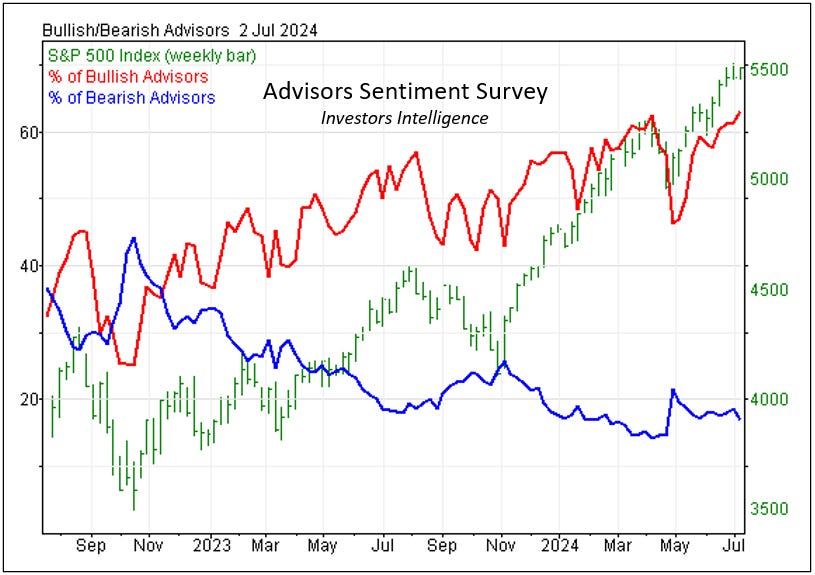
Perhaps one reason for the AAII’s near record allocation to stocks is because their financial advisors have rarely been so bullish. The latest Advisors Sentiment Survey from John Gray at Investors Intelligence was published on July 2nd. As illustrated in the chart above, bullish sentiment among professional investment advisors (people like ourselves) has pushed up to 63.1%, the highest reading since the April 2021 peak at 63.7%, and fourth highest reading in the last 20 years. Bearish sentiment among professional investment advisors has also fallen to just 16.9%. The April lows were 14.1%. Readings below 18% have tended to coincide closely with market tops. These readings remain in sync with numerous other sentiment measures that we follow. All indicate that a state of complacency has enveloped the market, including investors of every ilk — be it advisors, fund managers, traders, or individual investors.

Another gauge that might help to elucidate the situation is Volatility. The VIX is a naturally mean-reverting series with fixed downside limit. As such, it doesn’t always clearly reveal the magnitude of investor complacency toward risk. But when we view volatility through the lens of the S&P 500 relative to the VIX — that is the S&P 500/VIX ratio — we are able to observe the true extent to which complacency has overwhelmed investor behavior. As illustrated in the chart above, roughly 80% of all the data points in this relationship since 2009 have occurred above 100 and below 250. Readings at or near 300 reflect an attitude among investors of extreme complacency toward risk and have tended to coincide with important market peaks, while readings below 50 reflect an attitude among investors of extreme fear and have tended to coincide with important market bottoms. The problem as we see it, is that the bullish extreme being exhibited in this data series now suggests that investors have actually become more complacent toward the risk of a market decline today, than they were fearful of further market declines following the Great Financial Crisis (GFC). Indeed, portfolios are short volatility to an unprecedented extreme, either outright or indirectly. This condition creates a very dangerous set-up for stocks in our view.

The question that is being asked most frequently by our institutional clients is — if stocks are ripe for a big decline, then what’s the catalyst? And to that we answer — it could be anything, or nothing. In our experience, the stock market doesn’t need a catalyst to decline. A buyer’s strike is all it really takes. But there are many conceivable catalysts on the horizon, from the least probable — such as a Chinese military incursion into Taiwan, to the most probable — such as a major election upset. But more likely, it will be something as simple as a growth scare or a recession. As illustrated in the chart above, the Bloomberg Economic Surprise index just printed its lowest reading since 2016. In other words, the economic data has been surprising on the downside consistently over the past year, and has now fallen short of economists’ expectations by more than at any other point in the past eight years.

The latest example of this can be found in the ISM Services PMI. This Purchasing Managers Index series posted a very disappointing overall reading for the month of June — down 5 percentage points M/M — falling to 48.8 from 53.8 in May. A reading below 50 indicates a contraction in the data. Moreover, the changes in some of the components were even more harrowing. Business Activity dropped 11.6 percentage points M/M. New Export Orders fell 10.1 percentage points M/M. And both New Orders and the Backlog of Orders decreased 6.8 percentage points M/M. The Manufacturing Sector, which was already contracting in May, ticked lower in June as well, but the fact that the Services Sector (70% of GDP) is also rolling over should be of great concern to both the Fed and investors alike. It indicates that the U.S. economy is now contracting.

The latest update to the Atlanta Fed’s GDP nowcast supports this conclusion. Two months ago, the model’s estimate for 2Q24 real GDP growth was hovering just above 4.0%. Today, its hovering just above 1.0%, and below the Blue Chip consensus expectation. At present, three of our five core economic models are actively signaling a recession, and the other two are very close to triggering a recession signal. The pronounced weakening of recent economic data suggest that the U.S. economy has likely peaked. To be sure, the U-3 national unemployment rate has risen from a trough of 3.4% in April 2023, to now 4.1% in June.

A simple recession rule developed by Michael Kantrowitz of Piper Sandler suggests the U.S. economy may already be in the early innings of what could prove to be a prolonged economic recession. Since 1950, when the 3-month moving average of the number of unemployed persons increases Y/Y by > 10%, the U.S. economy has been in recession 100% of the time. Today, that number is up 11.9% Y/Y. Historically, according to the National Bureau of Economic Research (NBER), U.S. recessions have lasted approximately 11-months on average — in a range of six to 18-months.