
HUGE INSIGHTS: The Big Picture - Issue #47
Mid-Year Review & Outlook

Please enjoy the free portion of this monthly investment newsletter with our compliments. To get full access, you may want to consider an upgrade to paid for as little as $15/month. As an added bonus, paid subscribers also receive our weekly ALPHA INSIGHTS: Idea Generator Lab report, an institutional publication that provides updated market analysis and details our top actionable ETF idea every Wednesday. Thanks for your interest in our work!
Executive Summary
It’s a Bubble; So Just Buy & HODL?
Macro Perspectives: Bull Case vs. Bear Case
Geopolitics: Operation Bent Nail?
Market Analysis & Outlook: The Final Countdown
Conclusions & Positioning: Margin of Safety
It’s a Bubble
The S&P 500 closed out the first half of the year by posting new all-time monthly and quarterly closing highs, and then continued to drift higher into Thursday’s close. Several well-known stock market bulls have been making the rounds in the financial media over the past week to take their victory lap and gloat about “being right.”
Of course, these are the same stock market bulls that came into the year as bullish as ever. The same people that reiterated their bullish views at or near the February peak. And the same group that abruptly walked back their bullish views in early April following a 21.3% decline at or near the market’s nadir. They simultaneously slashed their 2025 EPS estimates, and raised their recession forecast odds to 60% or more for the year. This cohort then jumped back on the bull again once the S&P 500 reclaimed its 200-day MA. And while these bulls generally embrace narratives and abhor technical analysis, they can’t seem to stop talking about the fact that the S&P 500 just posted a “golden cross.”
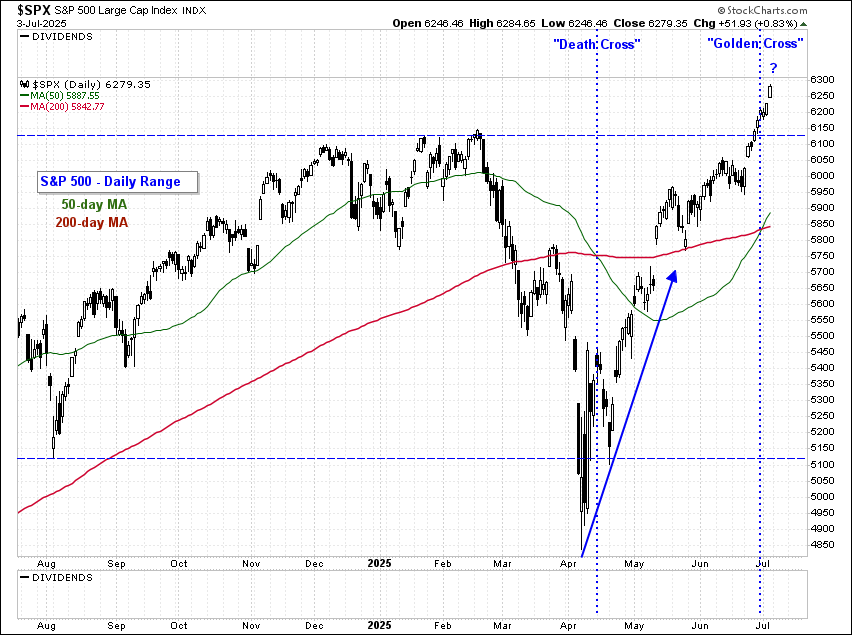
For the unindoctrinated, a golden cross is a bullish trend following signal that occurs when the 50-day MA crosses above the 200-day MA. As a trend follower who respects technical analysis, we have found little to be gained from chasing moving average crossover signals. Statistically, a golden cross is as likely to mark an interim high as it is to mark an upside acceleration. Recent evidence to that effect can be found by observing the results following the April 14th “Death Cross” (a bearish version of the same ilk). That signal failed spectacularly. Just one week after triggering a death cross, the S&P 500 posted a higher low and has since proceeded to rally nearly 23% to post marginal new daily, weekly, monthly, and quarterly all-time record closing highs.
We, on the other hand, were not bullish coming into 2025, and had highlighted the implications of high tariffs on the economy and the risks of a trade war in our December newsletter — Issue #40. Again, in both the January and February newsletters, we detailed our expectation for a market top in the first quarter and a major decline. And while we had been expecting a countertrend rally off the April 7/8th lows to retrace between one-third and two-thirds of the decline off the February 19th high, we did not expect the rally to recover above the 200-day MA, or to carry to new highs. Why not? Because we believe that the U.S. stock market is at the tail-end of a major bubble.
While most financial pundits claim that valuation is not a precise timing tool, we would say that it’s just a matter of investment horizon. Our former mentor and partner, Steve Leuthold, spent the better part of his 45-year career as an investment strategist proving that valuation is indeed an exceptional market timing tool. In 2012, he was presented with the CMT Association’s Annual Award for lifetime achievement in technical analysis. For his acceptance speech, he presented data and analysis supporting the conclusion that when the price/earnings (P/E) multiple reaches the top decile of historical valuation, forward 10-year returns are not just below average, but rank in the bottom decile of the historic record.
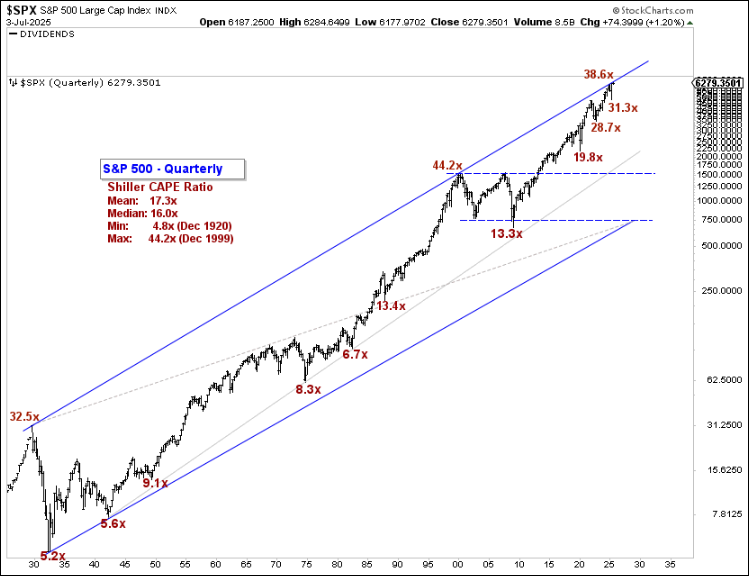
Steve used his own 5-year “normalized” earnings methodology to calculate the P/E for the S&P 500 each year in order to smooth out the cyclical peaks and troughs. A more widely accepted approach to normalizing earnings was developed by Professor Robert Shiller of Yale University. Shiller’s cyclically-adjusted price/earnings ratio (CAPE) has monthly data dating back to January 1872. When overlaid upon the S&P 500 index in the chart above (S&P data begins in 1926), we can clearly see a pattern whereby the past peaks in the CAPE ratio coincide perfectly with the past price peaks in the S&P 500 index. Our view that the stock market is at the tail-end of a major bubble is supported by the fact that today, the S&P’s CAPE ratio at over 38x is currently in the top decile of historical valuation. That’s approximately 17% above the October 1929 peak CAPE ratio of 32.5x, and just 13% below the March 2000 CAPE ratio of 44.2x.
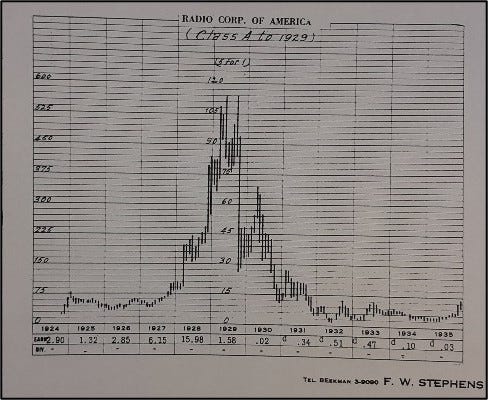
Both of the aforementioned periods rank as the two biggest stock market bubbles in U.S. history. The first of which was followed by an 89% drawdown before bottoming three years later. The second was followed by a 58% drawdown before bottoming in 2009. Both were periods of great technological achievement. Radio Corp of America (RCA) was the most beloved growth stock at the height of the roaring ‘20s stock market bubble. It was the company that ushered in broadcast radio — perhaps the most important new technology since the invention of the telegraph. RCA’s market value topped in September 1929 at $574 million. By May 1932, the stock price had collapsed by 98%, from a split adjusted high of $114.75, to a low of $2.63. The company survived the great depression by realigning its business model and muddled along for five decades until it was eventually acquired by General Electric in 1986 for an inflation-adjusted value of about $800 million.
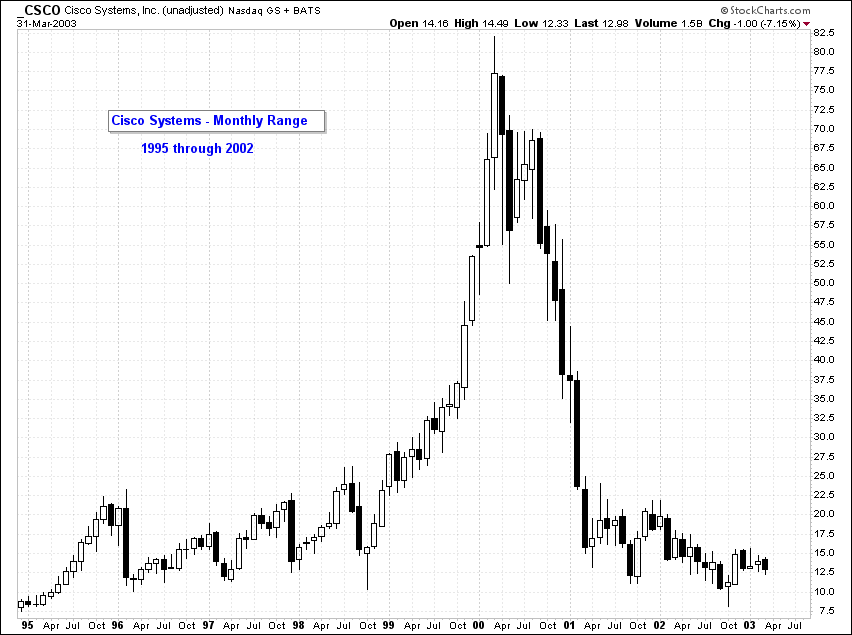
During the Dot-Com mania, the undisputed heavy-weight champ at the time was none other than Cisco Systems. CSCO was considered to be the most important company building out the internet. Their high-speed networking solutions were the state of the art, and their service and reliability was second to none. Without CSCO, the internet as we know it today would not have been possible. So beloved was CSCO, that it became the first publicly traded company in history to reach a half-trillion dollars in market capitalization. It’s market value peaked on March 27th, 2000 at $569 billion. Buy October 2002, CSCO’s stock price would decline by 93% from a high of $82, to a low of $5.66. CSCO too has been muddling along for the last 23 years or so, but despite being added to the prestigious Dow Jones Industrial Average (DJIA) in June 2009, the stock price has never fully recovered, and remains more than 16% below its March 2000 all-time high.
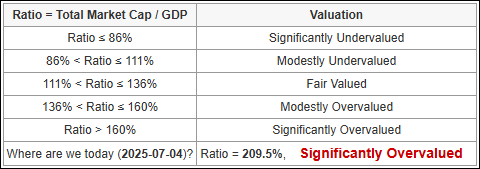
Notably, the market capitalization of the Wilshire Total U.S. Stock Market is now 210% of U.S. GDP. According to GuruFocus, at about 125%, the so-called “Buffett Indicator” is considered to be fairly-valued. At the height of the Dot-Com bubble, this valuation metric reached a peak of 143%. So by comparison, using Warren Buffett’s favorite measure of valuation, the stock market is approximately 47% more expensive today than it was in March 2000, when CSCO posted its all-time record high.
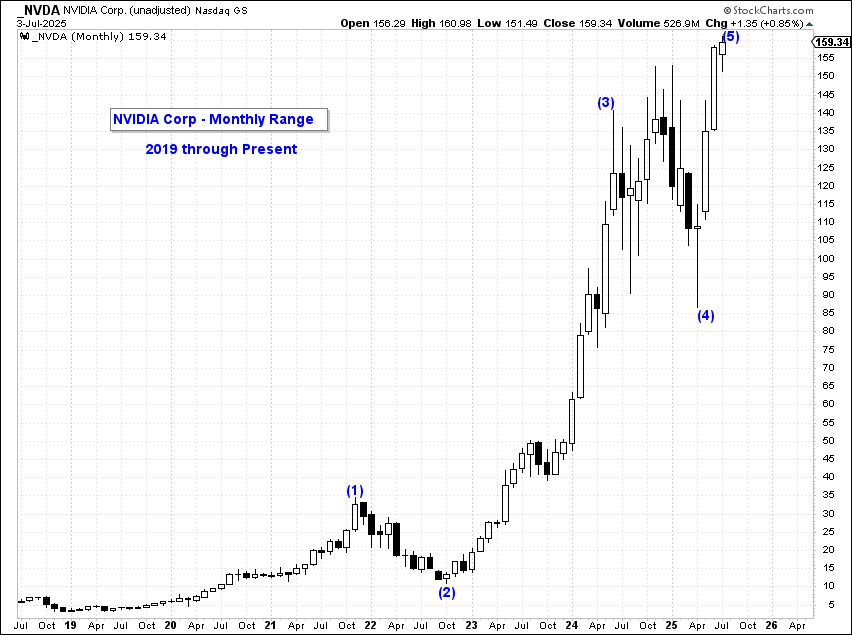
Today’s hot dot is NVIDIA, the new king of the hill. On July 3rd, NVDA’s market value hit an all-time record extreme of $3.9 trillion. It’s currently the most valuable publicly traded company in history. NVDA designs graphics processing units (GPU), which is a specialized electronic circuit made to accelerate the processing of images, videos, and complex mathematical calculations. It was originally developed for the video gaming market, but is now widely used in machine learning for generative AI.
The company has an asset light business model, so it has no real manufacturing assets — just contracts, intellectual property, inventory, some industrial and office real estate, and a small VC incubator. TSMC is its sole supplier, and over 90% of the company’s products are currently manufactured in Taiwan. If the Chinese PLA decided to impose a military blockade surrounding Taiwan tomorrow, NVDA would be effectively out of business. It’s a shell of a company whose tangible book value equates to about $78 billion (2% of its current market value), or about $3.18 per share. The stock is trading for about $160 today. Does anyone want to hazard a guess as to where NVDA’s stock is headed once this bubble pops?
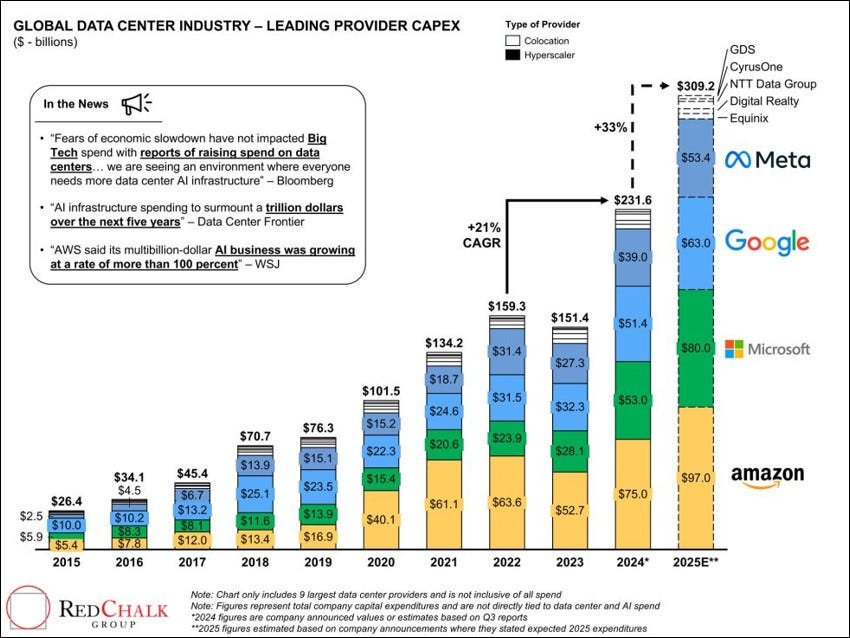
We are not alone in our view. A growing body of well-informed analysts and investors are voicing their doubts about the need for the epic scale of AI-related infrastructure investments currently on the drawing board. According to a report published by the Gartner Group, over 40% of agentic AI projects will be scrapped by 2027. Anushree Verma, a senior analyst at Gartner, believes that most agentic AI projects are just early stage experiments or proof of concept endeavors that are driven by hype and are often misapplied. Verma wrote,
“Most agentic AI propositions lack significant value or return on investment, as current models do not have the maturity and agency to autonomously achieve complex business goals or follow nuanced instructions over time.”
Tech giants such as Salesforce.com and Oracle have embraced AI agents, systems that can autonomously complete goals and take action, pouring billions into the technology in the hopes of boosting margins and optimizing costs. But many vendors are engaging in “agent washing” — the rebranding of products such as AI assistants and chatbots without significant agentic capabilities. Gartner estimates that only about 130 of the thousands of agentic AI vendors are actually real.
Venture capitalist Josh Wolfe, co-founder of Lux Capital, told the audience at the Axios AI Summit in New York on June 4th that he sees parallels to the tech booms of the past. “Cloud computing and fiber optic network investments created a lot of millionaires in the 1990s and early 2000s,” but Wolfe also remembers that many of those investors were left holding the bag when production ultimately outpaced demand, “I think you’re going to have the same phenomenon now.” He noted the potential danger of groupthink in the tech sector, where building data centers seems prudent for individual companies. However, he fears that multiple companies building hyperscale data centers simultaneously, “collectively becomes irrational.” “It will not necessarily persist,” he warned. Wolfe also thinks the potential fallout from the bubble popping extends to other sectors. Data centers consume incredible amounts of power, which has driven rapid growth in the nuclear energy sector. Wolfe said,
“One take that is related to that is the demand for energy. It’s presumed that, because you need all these data centers, you then need small modular reactors. And so, you’re getting a lot of speculative capital that’s going into the energy provision therein.”
To quote the famed speculator George Soros,
“Every bubble consists of a trend that can be observed in the real world, and a misconception relating to that trend. The two elements interact with each other in a reflexive manner.”
So Just Buy & HODL?
Buy and hold is an equity market strategy that has long been endorsed by Wall Street and the financial planning community as the key to building wealth over time. But, over the long term, only a small percentage of companies create most of the aggregate wealth in the stock market. In statistics, skewness measures the asymmetry of a distribution and kurtosis reflects the fatness of the tails, or number of extreme values. Long-term equity returns for companies are positively skewed and have high kurtosis.
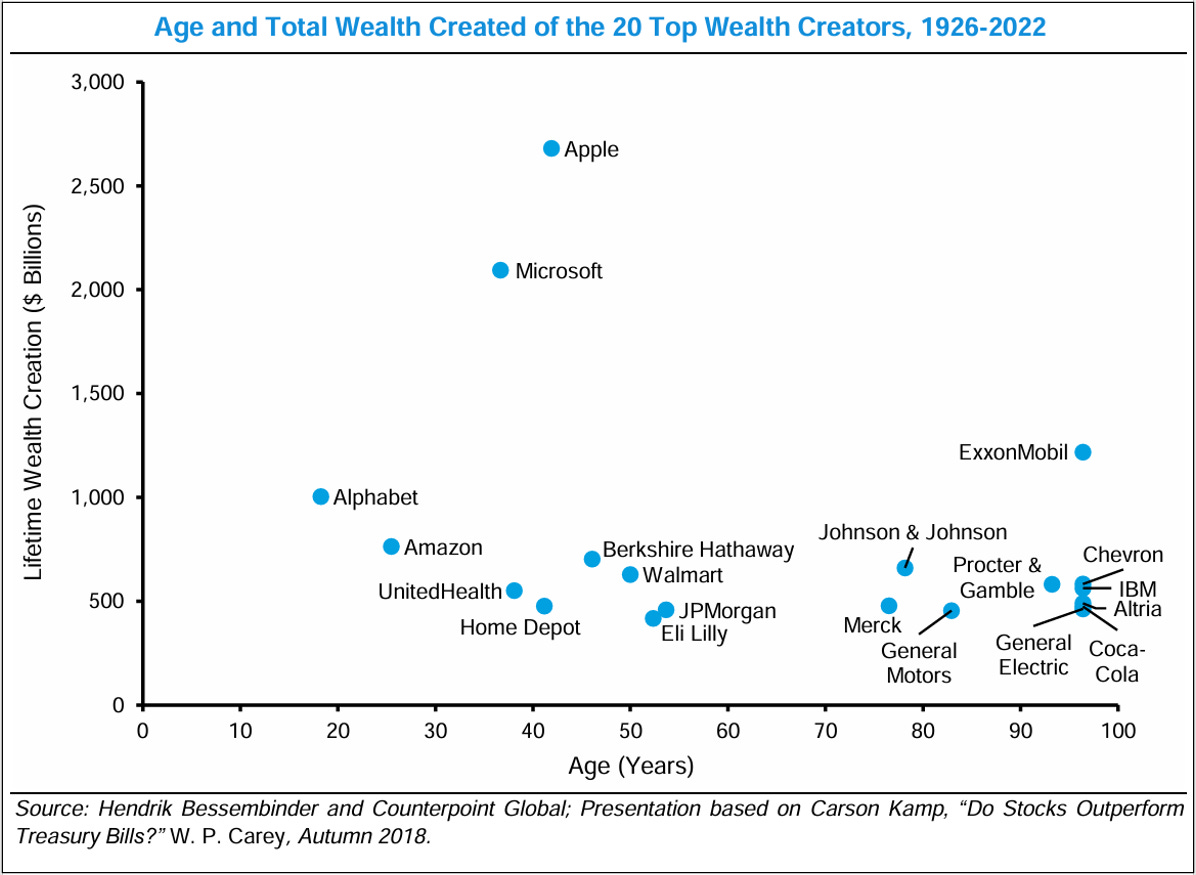
Hendrik Bessembinder, the Francis J. and Mary B. Labriola Chair in Competitive Business, and a Professor of Finance at Arizona State University, studied roughly 28,100 public companies in the U.S. that have been listed since 1926. He defined wealth creation as earning a return higher than one-month Treasury bills. He found that about 16,500, or just under 60 percent of the sample, destroyed $9.1 trillion in value through December 2022. The other 11,600 or so, slightly more than 40 percent, created $64.2 trillion in value. Of that net wealth creation of $55.1 trillion, more than $50 trillion was attributable to just 2 percent of the sample. The top three performers — Apple, Microsoft, and ExxonMobil — alone added almost $6 trillion. The exhibit below details the age and total wealth created by the top 20 wealth creators from 1926 to December 2022. This collection of companies created wealth of $15.7 trillion through 2022.
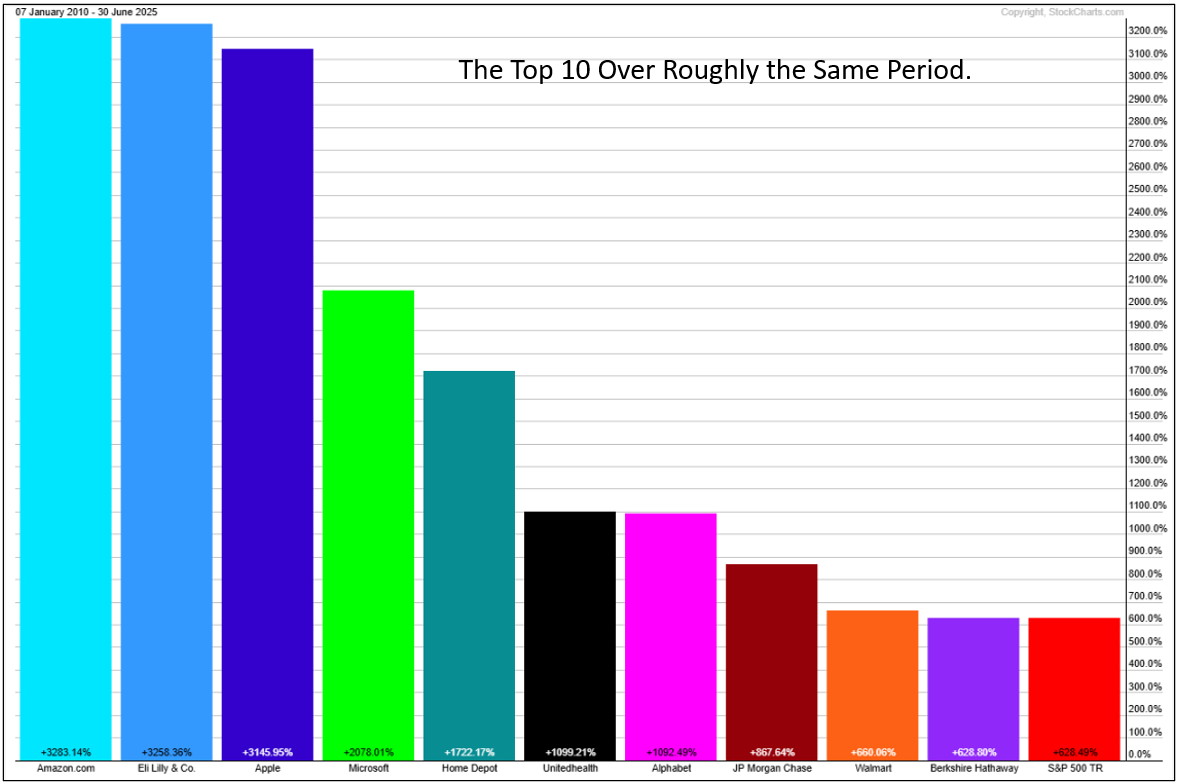
Since the last trading day of 2022, the S&P 500 index is up 61.1% through June 30, 2025. Aside from General Motors, which filed for chapter 11 bankruptcy protection in 2009, these twenty companies all fall within the top quintile of market capitalization within that benchmark. Thus, it would not be a stretch to suggest that the amount of wealth created by these leaders likely exceeds $25 trillion today, or about one-third of all of the net wealth ever created by the U.S. stock market.
We see a number of less obvious, but very important takeaways from this study that investors should consider before allocating any additional capital to the U.S. equity market. First, Bessembinder’s calculation translates relative total shareholder gains and losses from percentages into dollars. This is akin to the relationship between return on invested capital or ROIC (percentages) and economic profit (dollars) in the study of corporate finance.
Active investors focus predominantly on the percentage changes in their portfolios measured relative to an appropriate benchmark. As such, a portfolio manager will consider two distinct positions of the same size that outperform a benchmark by 10 percentage points over equal time spans to be equivalent, all else being equal. But if the beginning market capitalization of the first company is $3 trillion and that of the second is $30 billion, the wealth creation in the first case is 100 times that of the second. Investors need to consider dollar changes when the size of the investment is sufficiently large relative to the asset class.
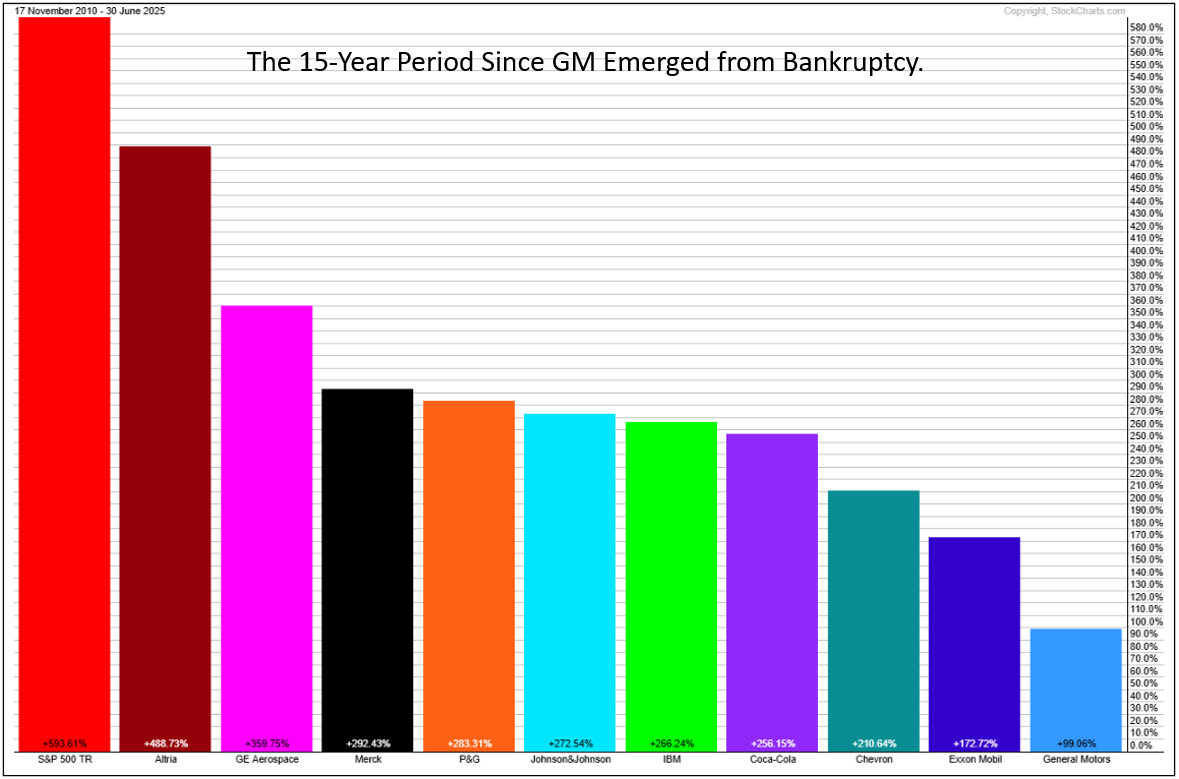
Second, the leaderboard of wealth creation can reflect outperformance from decades ago. The exhibit above illustrates this point clearly when one focuses on the companies in the bottom right corner. The stocks of many of these companies have been laggards for years, yet they still appear high on the list because of how they did long ago. For instance, ExxonMobil, IBM, General Electric, and General Motors are in the top 20 in part because of the performance of their stocks in the 1950s. These were large capitalization companies that did well enough to allow them into the wealth creation hall of fame. Although, to be clear, General Motors died in 2009 when it declared bankruptcy. All common stock shareholders were wiped out.
These results appear highly relevant for long-term shareholders. But investors can lose sight of these extreme outcomes because they are a consequence of compounding over many decades. Further, while returns for individual stocks may display positive skewness, returns for the aggregate stock market have negative skewness. Even investors with long investment horizons, including endowments and pension funds, tend to evaluate results over periods that are too short to reveal the full effect of compounding. Bessembinder uses some simplified assumptions to show how portfolio concentration and the frequency of rebalancing affect skewness. High concentration and infrequent rebalancing lead to high skewness. Long-term returns for investment funds also convey different information than short-term returns.
This raises another issue. Most institutional money managers have a fiduciary responsibility to put the interests of clients first. This commonly includes guidelines for portfolio diversification and risk management. For example, stocks that compound at a high rate can become too large in a mutual fund portfolio and violate parameters for diversification, market capitalization, or risk that are described in the fund prospectus. Index funds, for the most part, do not have this problem. Most of the richest people in the U.S. have the vast majority of their wealth in a single asset, usually the stock of the company they founded or of which they are large owners.
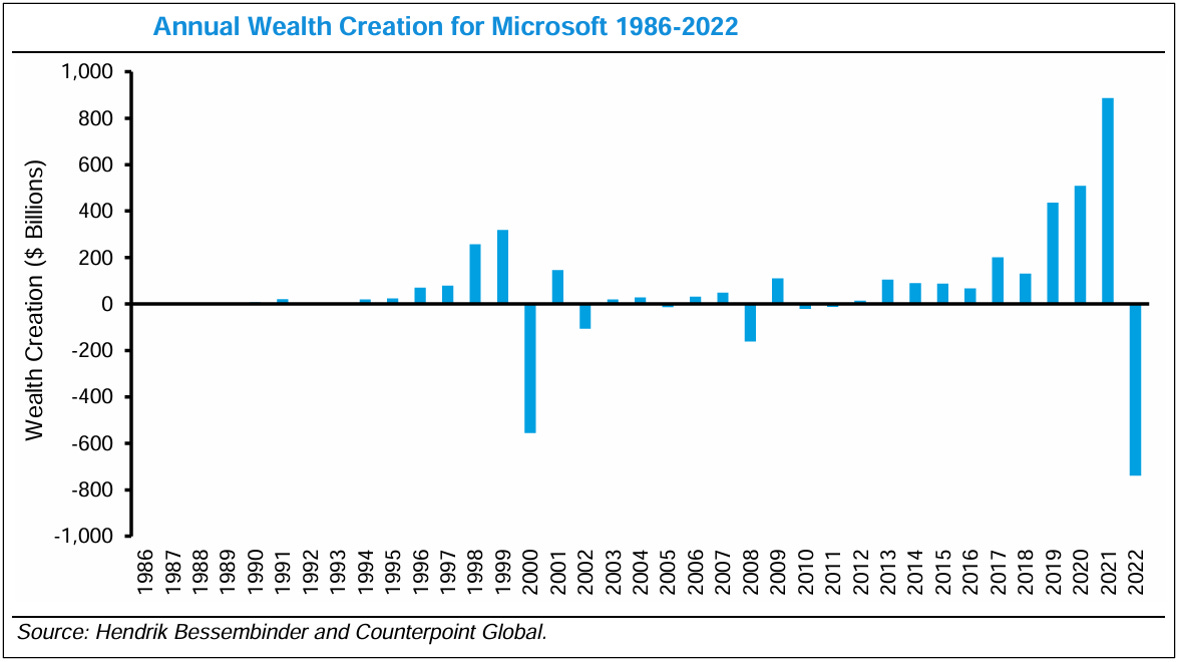
The counterpoint is that the list of the top wealth creators is based on what they have done rather than what they may do. The exhibit directly above shows the annual wealth creation of Microsoft from its IPO in March 1986 to December 2022. The aggregate wealth creation is nearly $2.1 trillion, placing the company at number two on the total wealth creation list as of 2022. However, there are extended periods when the stock underperformed Treasury bills. For example, the stock’s total return was -69% over 111 months from January 2000 to March 2009.
Active managers seek to capture a sliver of the wealth generated by the best-performing public companies. Doing so is obviously difficult, but Bessembinder studied the set up and characteristics of the top wealth creators. Here is some of what his work revealed:
There will be stock price drawdowns. The stocks of the best wealth creators over time went through substantial drawdowns. For example, Apple, which created nearly $2.7 trillion in wealth from its IPO in 1981 to the end of 2022, suffered three drawdowns of 70 percent or more over that span. Apple was the top wealth creator through the end of 2022, but most investors would have struggled to hold the shares through these declines. The shares of Amazon offer another case, having suffered a drawdown of more than 91 percent from February 2000 to September 2001 on their way to being among the best wealth creators. And lest we forget, General Motors went to zero — so, you never know!
It’s not just technology. While companies in the information technology sector may come to mind first when considering the top wealth creators, Bessembinder found that these companies were underrepresented among the best. Sectors that were overrepresented among the winners included healthcare and energy. Industries with high variance in ROIC tend to be represented among the top and bottom groups in wealth creation.
There are common characteristics of the winners. Bessembinder considered a slew of financial metrics to assess which ones, if any, were consistent with substantial wealth creation. Large increases in net income, rapid asset and sales growth that the company generated internally, a rising return on assets, above-average research and development (R&D) spending, and cash accumulation were among the characteristics of the top wealth creators.
Below we’ll discuss why we think the risk of recession continues to be underestimated by the consensus. We will also discuss why we think interest rates are likely to increase, not decrease before year-end. In addition, we’ll examine recent geopolitical events in the Middle East and their implications for continued heightened risk of global instability. Finally, we present our comprehensive analysis of equity markets, commodities, currencies, crypto, and rates, then review our “Perfect Portfolio” asset allocation strategy (+10.7% year-to-date through 6/30/25), which details how we believe investors should be positioned today in order to thrive during what promises to be a period of sustained volatility in the weeks-to-months immediately ahead.
Let’s begin…