Please enjoy the free portion of this monthly newsletter with our compliments. To get full access, you might want to consider an upgrade to paid for as little as $10/month. As an added bonus, paid subscribers also receive our weekly ALPHA INSIGHTS: Idea Generator Lab publication, which details our top actionable trade idea and provides updated market analysis every Wednesday, as well as other random perks, including periodic ALPHA INSIGHTS: Interim Bulletin reports and quarterly video content.
As we’ve been arguing for months, the bull case hangs by a mere thread. In January, it hinged on the extrapolated view that inflation was receding more expeditiously than anticipated, and that the Fed — nearly done tightening policy — might even pivot before year-end, despite explicit statements to the contrary. That opinion is now largely off the table following a series of unexpectedly hot economic data points, including the January NFP report, the CPI and PPI reports, the retail sales report, the PCE report, and most recently, the Chinese manufacturing PMI report, which just hit a new 10-year high.
Today, following a 20% countertrend advance off the October lows through January, the bull case is built entirely on the notion that the 200-day moving average (DMA) represents some magical line of demarcation, by which bull markets and bear markets are authoritatively judged, and that so long as the S&P 500 holds above it, a new bull market remains intact. We’ve already debunked that theory a year ago when we exposed the 200-DMA for what it really was, as an arbitrary measure of the long-term trend, popularized by famed market timer Joe Granville in the 1960s and 70s. It has since found its way into most charting platforms and trading systems as the default setting.
We have no problem with the 200-DMA per se, but wish only to clarify that there is nothing particularly important about it other then the fact that so many people now watch it very closely. During the next phase of this bear market, we think its true significance will be revealed — as a sell signal to market watchers when price fails to hold above it. Which brings us to the point of this missive — risk management.
As illustrated above, global macro risk is like an iceberg. There are conditions that are visible to all, conditions that are visible to some, and conditions that are visible to none. We can further break it down into four tiers of global macro risk: 1) the known knowns; 2) the known unknowns; 3) the unknown knowns; and 4) the unknown unknowns.
The known knowns are all of the obvious risks that we know about and understand. For example, inflation, monetary policy, recession, the budget deficit, and the rising national debt all fall into this camp. Then there are the known unknowns. These are conditions that we can cite as potential risks, but don’t yet have a full understanding of when, or if, they will impact the investment landscape. Case in point, an escalation of the war in Ukraine, or the Chinese economic reopening. These first two tiers of risk are manageable, because the capital markets are constantly evaluating them and repricing to adjust for the steady flow of new data points. The adjustments tend to be orderly, because new data comes with high enough frequency that surprises are relatively tame in both directions, and it is the trend of the data that really matters.
Things start to get tricky when dealing with unknown risks. Let’s consider the unknown knowns next. These are the risks for which we have all of the information necessary, but because we have not yet connected the dots in order to see the full risk picture clearly, they are not fully priced into the market. For instance, we know that Xi Jinping and the CCP have established a mandate to reunify Taiwan with China. We also know that the Chinese armed forces have been readying themselves for a military incursion into Taiwan for a number of years. And finally, we know that if they take Taiwan, they will control the single most important driver of the global economy — semiconductor production — until at least 2030. What we don’t know is whether all of their saber rattling is for show, in order to further solidify domestic political control, or whether they actually intend to pursue their stated foreign policy goals.
Finally, we must also consider that there are always “unknown unknowns.” This is a phrase that was popularized by former Secretary of Defense, Donald Rumsfeld, during a televised speech prior to the U.S. invasion of Iraq. By definition, it represents a risk that cannot be anticipated — a black swan, and therefore is potentially the most dangerous tier of risk. The consequences of such risks are not priced into the market, as can be exemplified by the advent of COVID-19. Examples that might be applicable today would include the risk of nuclear war, a devastating natural disaster, or a even sovereign debt default by a member of the G-7. Or, if you’re fan of the Terminator film franchise, think about the implications of is statement from Nvidia CEO Jensen Huang, who on his quarterly conference call opined, “Over the course of the next 10 years…I believe we’re going to accelerate AI by another million times.”
Evaluating the Known Knowns
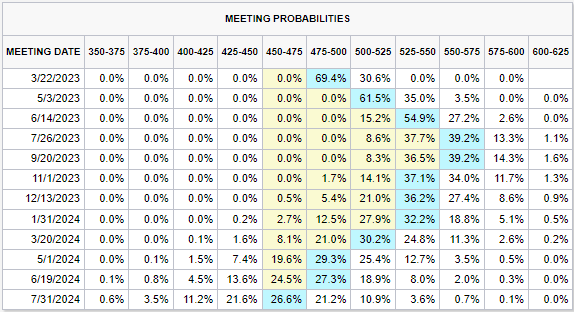
Perhaps the most anticipated known known is the risk of recession. Just three years ago, the global pandemic created a new set of known unknowns that caused authorities to take the unprecedented action of releasing approximately $9 Trillion in fiscal and monetary stimulus into the U.S. economy over a very short period of time. The result has been the highest inflation rate in over four decades. The passive response to early evidence of these consequences only exacerbated the problem, allowing the wound to fester and expand. Once it became clear that inflation was not transitory as was previously assumed, but was on the verge of raging out of control, the Fed was forced to take decisive action. In so doing, they have since raised their benchmark lending rate from effectively zero to 4.50%, and are now poised to raise it further by another 100 bps to 5.50%, according to the Fed funds futures curve.
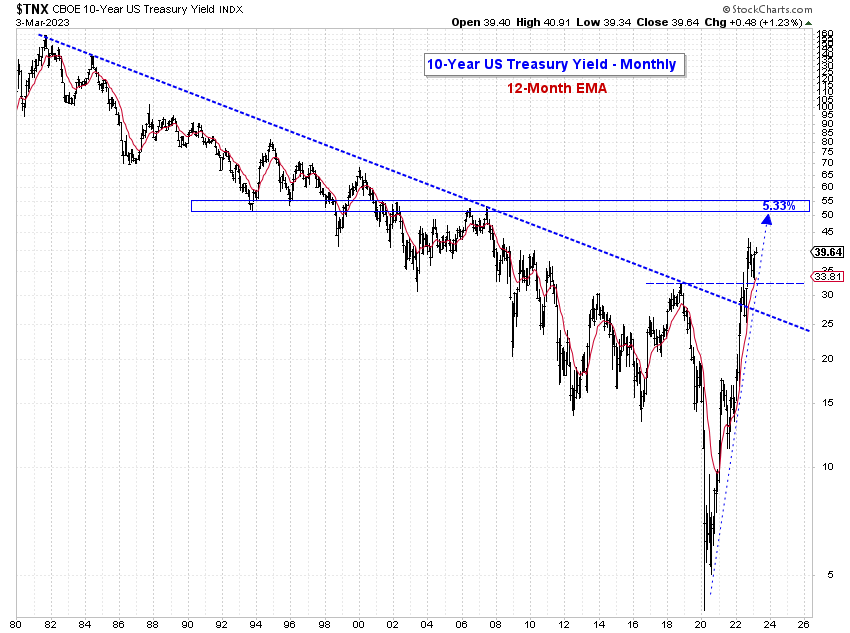
Inflation concerns appear to be justified based upon the latest economic data, and a further tightening of monetary policy should be expected. We found this excerpt from David Einhorn's Interview w/ CNBC on Wednesday, March 1st, to be of particular interest. The Founder of Greenlight Capital, Einhorn is a well-regarded value investor who is notoriously obsessed with analyzing financial statements. During the interview, when asked for his opinion regarding inflation, Einhorn didn’t pull any punches, “I think we should be bearish on stocks and bullish on inflation.” His thesis dovetails well with our own, that inflationary pressures will persist longer than most expect, forcing the Fed to remain tighter for longer, and that the rate cycle has much more runway ahead of it. While currently challenging the 4.0% level, our work suggests that the 10-year Treasury yield is poised for a further rally that targets 5.33%, but longer-term we think that it could eventually eclipse the 6.0% level before topping.
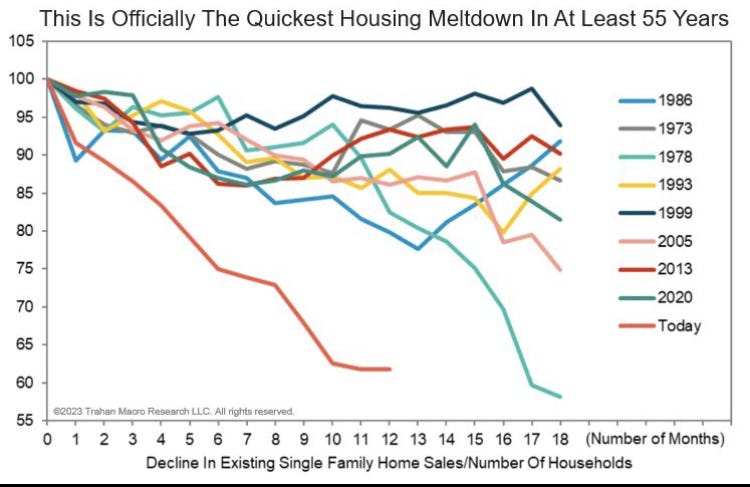
While we have been adamant about the fact that it takes 6-12 months for the true impact of monetary policy changes to be fully realized by the economy, it’s noteworthy to point out that the one-year anniversary of the Fed’s first 25 bps rate hike will be celebrated this month. While there can be no doubt that the economy has already experienced some impact from the Fed’s tightening cycle, most notably in the housing sector, which has arguably witnessed the fasted meltdown in the history of the data, we are likely still early in the process of slowing the economy. The housing sector, given its interest rate sensitivity, is the tip of the economic spear. It is the first to respond to rate hikes and the first to respond to rate cuts.
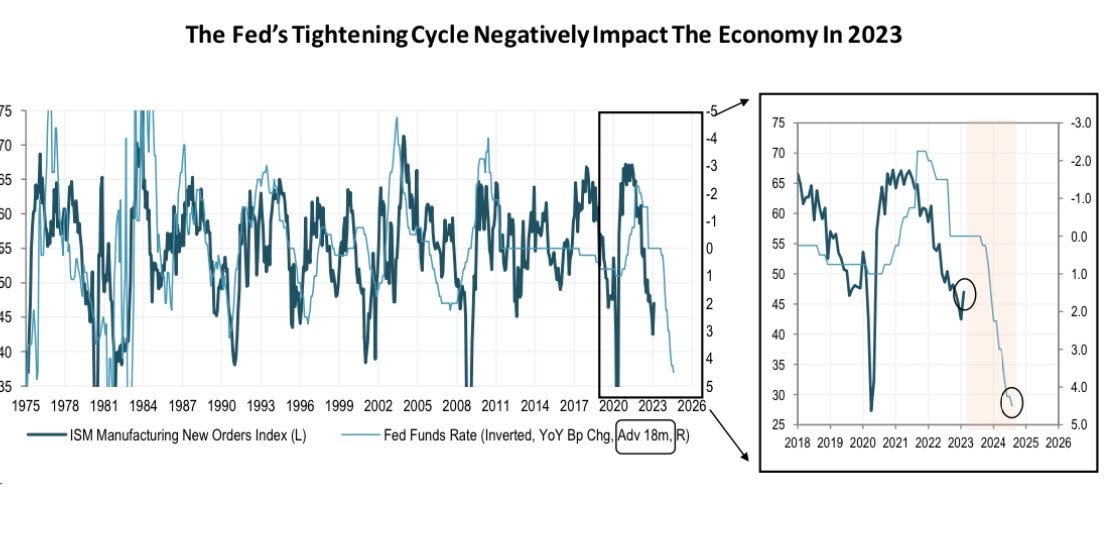
The real test will come as the economy anniversaries the June and July rate hikes. Collectively, the Fed had raised rates by over 200 bps as of the July meeting last year. There has historically been a reliable inverse correlation between monetary policy actions and the ISM Manufacturing New Orders Index that occurs with a 12-month lag. We think the U.S. economy will most likely follow this relationship into recession by mid-year 2023 at the latest.
Examining the Known Unknowns
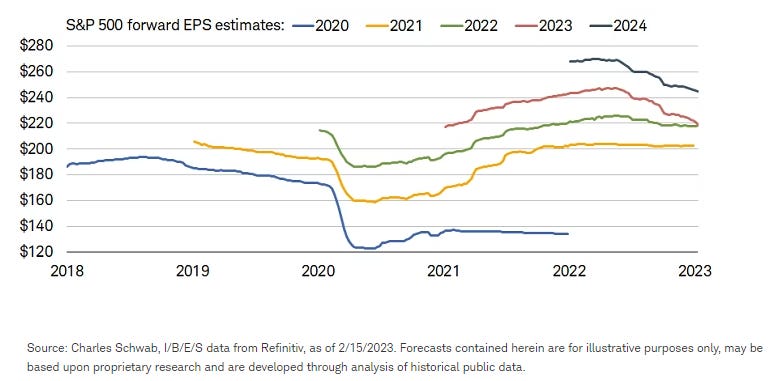
Consensus S&P earnings estimates have been in a free fall since the end of 3Q22. According to S&P Capital IQ, the street now expects calendar 2023 op-EPS of just $218.68. When compared to their 2022 estimate of $219.38, that’s a Y/Y decline! Recall that one year ago, the consensus was forecasting 2022 and 2023 earnings growth of 10.5%. It now looks like 2022’s growth rate will finish the year at exactly half the original estimate, while 2023 is poised to go negative. All hope is now focused on 2024. Not surprisingly, the consensus forecast for the out year is a very healthy 13.4% Y/Y growth for S&P op-EPS. Of course Wall Street’s expectations are predicated on the “no landing” fantasy, whereby the Fed is successful in its efforts to vanquish inflation through aggressive rate hikes, but revenue growth somehow accelerates (right, and then they all lived happily ever after).
But the truth of the matter is that Wall Street has no idea what earnings are going to look like in 2024. Just like they had no idea what they were going to look like in 2023, or 2022 for that matter. What is unknown about this known is just how badly the street is going to get it wrong this time. In our view they already have it very wrong. They key assumption for 2024 is that operating margins will recover to their 2021 all-time highs. But, as Jeremy Grantham is fond of saying, “margins are the most mean-reverting series in finance.” And considering the fact that they are currently trending lower and are still some 300 bps above their long-term mean, it seems more probable to us that margins will retest the mean before ever making a new cyclical high.
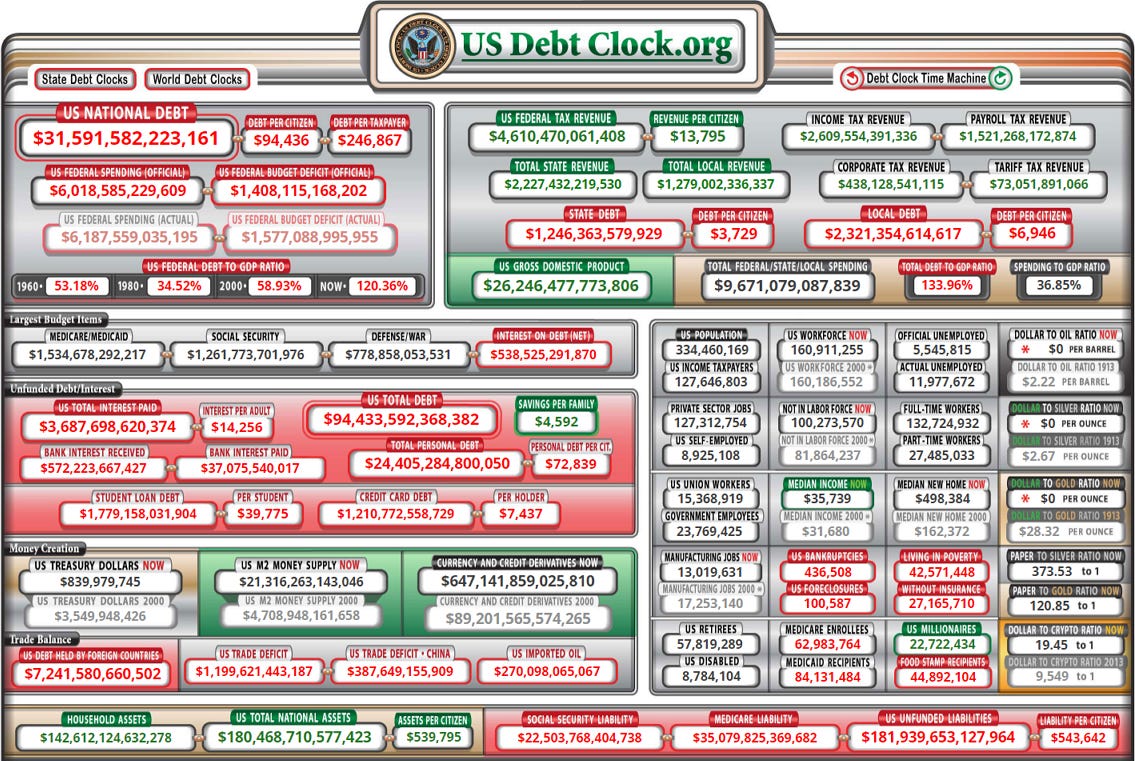
Another known unknown pertains to the U.S. national debt. What is known is that total U.S. government debt has now reached a level exceeding 120% of GDP. The CBO projects a federal budget deficit of $1.4 Trillion for 2023, or about 5.3% of GDP. It further estimates that the annual budget deficit could reach $2.7 Trillion, or 6.9% of GDP, within the next 10 years. Under these assumptions, the U.S. national debt is expected to rise to approximately $50 trillion by the year 2033. What is unknown is at what level the liabilities of the U.S. will cripple its own ability to service them.
A potential debt ceiling crisis began unfolding in the U.S. on January 19th, when the United States hit its own self-imposed debt ceiling. It’s part of an ongoing political debate in the U.S. Congress over federal government spending and the national debt. Although Congress has already voted to approve a budget to spend over $6 Trillion in 2023, unless they raise the limit on the debt ceiling, the U.S. Treasury could potentially face a technical default on its current obligations. While at face value, this


