

HUGE INSIGHTS: The Big Picture - Issue #16

Please enjoy this monthly newsletter with our compliments. To get full access to our ALPHA INSIGHTS: Idea Generator Lab content, which includes our top stock or ETF idea each week, become a dues-paying member for just $10 a month by clicking here.
The debate among financial media pundits over the state of monetary policy and its relationship with the economy and the markets brings to mind a famously funny scene from the brilliant comedy film, Monty Python and the Holy Grail.
The scene opens circa 932 A.D. with a mob of villagers carrying a woman dressed to look like a witch, with an obvious false nose made from a carrot and a pointed hat, shouting from the top of their lungs, "She's a witch!" They present her to Sir Bedivere, the town adjudicator, stating, "We found a witch. May we burn her?" Bedivere asks the mob leader, "How do you know she's a witch?" The mob leader responds, "Because she looks like one!" The mob then cries out in unison, "Burn her!" The woman objects, "I'm not a witch, they dressed me up this way."
What follows is a hilarious process of deductive reasoning resulting in the conclusion that if she weighs the same a duck, then she must be a witch. If you're not familiar with the movie, then watch the attached 4-minute YouTube clip below. If you are familiar with it, watch it anyway. It never gets old!
She's a witch! — www.youtube.com Monty Python and the Holy Grail... :D
The Madness of Crowds
The fallacy of reasoning, and the broad misunderstanding of certain basic economic relationships that is on display today in the public square is almost as comical as that which is illustrated above by the renowned British comedy troupe.
Part of the problem is that instead of trying to model the most severe tightening cycle in over 40 years and its expected impact on the economy and earnings, otherwise well-educated experts in the fields of finance and economics have shifted the primary focus of their attention to their hobby -- market psychology.
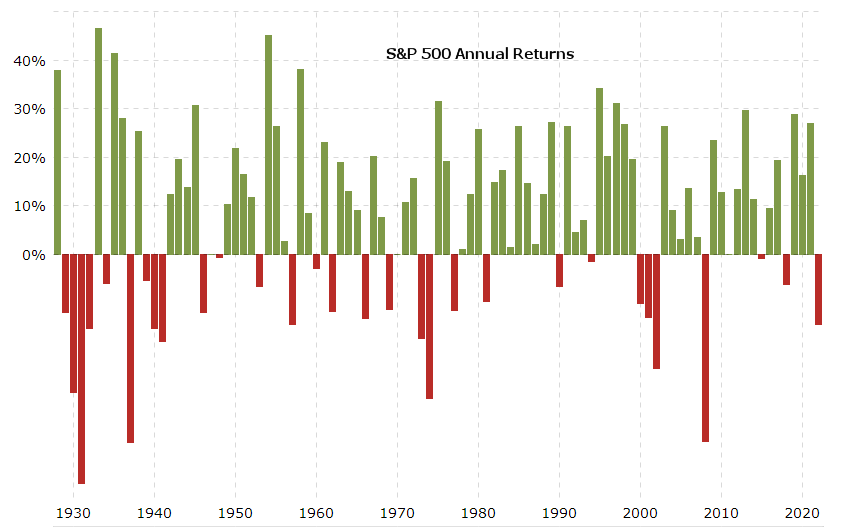
Indeed, despite the impending recession and concomitant earnings collapse that may lie ahead, the most widely held view from Wall Street strategists is that if the overwhelming majority of investors are bearish on the economy and the stock market -- as many surveys suggest, then the savvy move would be to buy stocks while they are down 20%, because they are now "cheap," and historically (looking at data going back to 1950), over the subsequent 12-months the stock market has always fully recovered, with the exceptions of 2001, 2000, 1973, which of course included extreme circumstances.
But when we turn the clock back just a little further, we find that the exceptions to the rule -- which also include 1947, 1946, 1940, 1939, 1931, 1930, and 1929, are almost as common than the rule itself. Thus, the bull's argument relies on a smaller and less reliable sample size, which suffers from "self-selection bias," and should not be trusted. Mark Twain put it this way, "There are liars. There are damn liars. And then there are statistics."
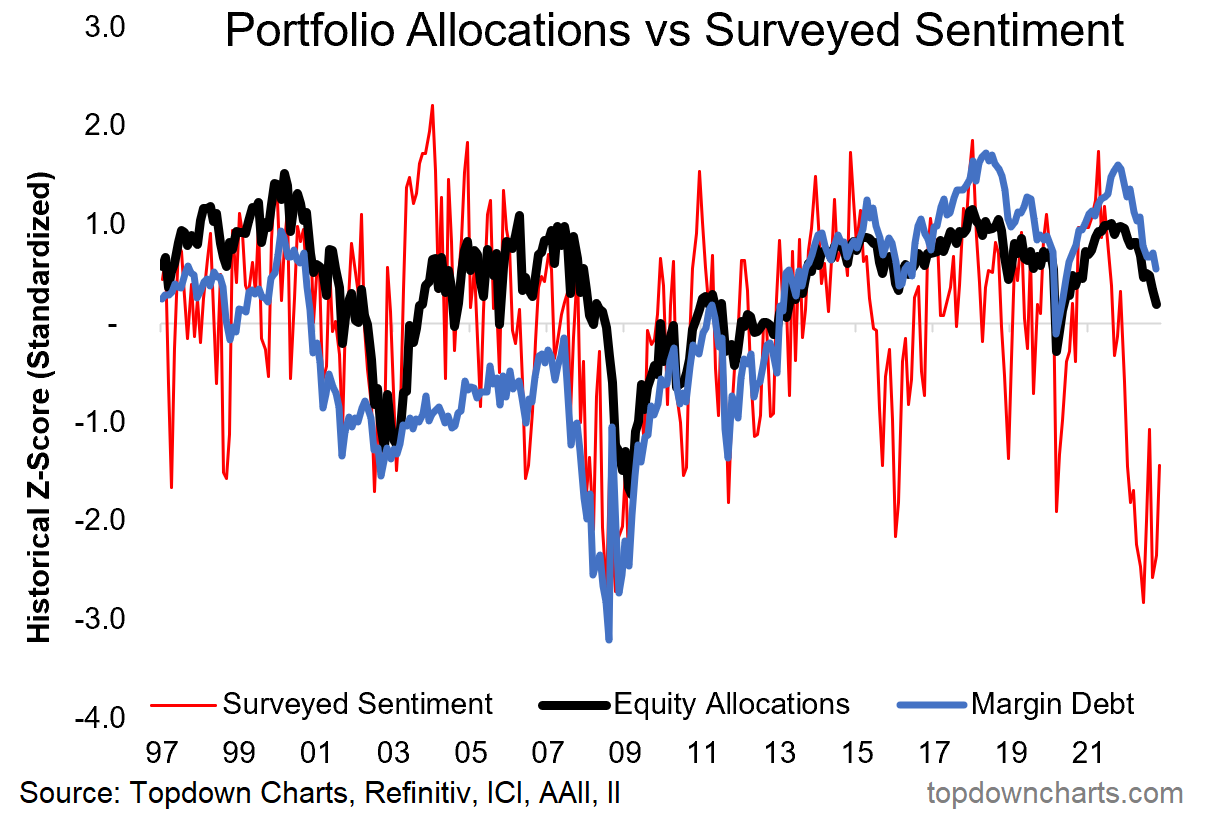
Aside from the aforementioned data mining, the more serious problem with this logic is that it's an argument built upon a false premise. It erroneously assumes that because investors are feeling bearish, they must have already liquidated their portfolios. In other words, "if it floats, then it must be made of wood." In fact, as illustrated below, despite the elevated level of bearish sentiment evident in the popular surveys, investor leverage and equity allocations remain well-above the historical liquidation lows of the past 25 years. To the contrary, margin debt today -- although down 30% from the 2021 peak -- remains well-above the 2000, 2007, and 2018 peak levels. Meanwhile, equity allocations are still holding at up to two standard deviations above prior liquidation lows.
The Truth About Monetary Tightening
The truth of the matter is this, the reason that Wall Street strategists have been so focused on market psychology is because there really is no historical precedent to lean on for perspective with respect to the current tightening cycle. Never before in the history of the Federal Reserve has monetary policy remained so accomodative for so long, and then abruptly tightened so severely in such a short period of time. Economists literally have no idea how this is going to play out.
To make matters even worse, very few of today's investment professionals on Wall Street, or even Summer Street, began their careers prior to 1981, and have the actual experience of a severe tightening cycle to look back upon for reference. Indeed, the current generation of investors only really knows and understands an environment of low interest rates, accomodative fiscal and monetary policy support, and untethered growth driven by the wealth effect. But the season has now turned. Unfortunately, the leveraged speculating community continues to play like grasshoppers in the tall grass, while only a few squirrels have had the wisdom to begin gathering acorns to get them through the winter. And winter is coming!
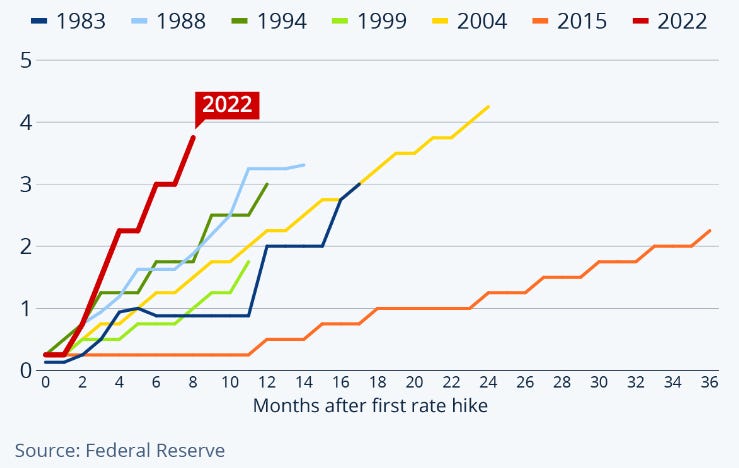
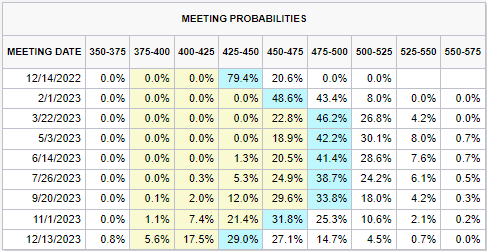
Again, the policy environment has shifted from accomodative to restrictive. Just how restrictive is yet unclear, but likely more impactful than "very small rocks." In addition to the 375 bps of tightening referenced in the chart above, the Fed is poised to raise its benchmark lending rate by another 50 bps on December 14th. According to CME Group, looking out to mid-2023, the probabilities currently favor a terminal Fed funds rate of at least 4.75-5.00% by March 22nd and on through to the November 1st meeting.
While the Fed has acknowledged some progress in their fight against inflation, they are far from through. Personal Consumption Expenditures (PCE) were reported on Thursday up 6.0% y/y. The number beat expectations slightly. The core PCE (ex-food and energy) was reported up 5.0% y/y, also a slight positive surprise at the margin. But New York Federal Reserve president John Williams, in a speech that took place shortly thereafter, stated that he will not be satisfied that the FOMC has successfully completed the task of defeating inflation until the Fed funds rate exceeds the CPI inflation rate.
Lest we forget, interest rates are not the only policy lever that the Fed has their hands these days. Fed Chairman Powell has been very clear that the central bank's plan is to allow its balance sheet runoff at a rate of $95 billion a month until it reaches pre-crisis levels. Recall that Chicago Fed President Charles Evans is on record stating that this could take as long as three years at the current run-rate.
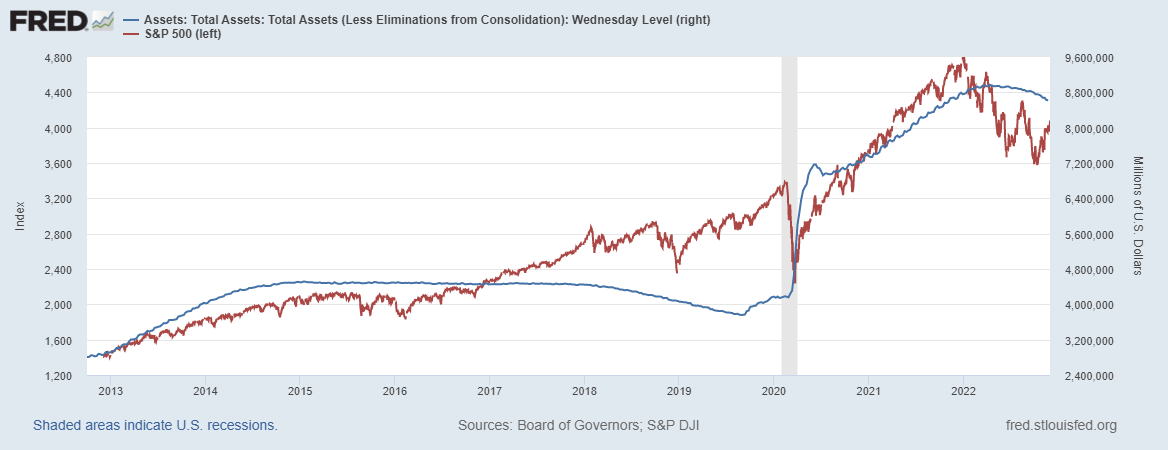
Importantly, since at least 2013, the S&P 500 index has maintained a fairly tight correlation to the size of the Fed's balance sheet. The systematic global macro team at GMO, in their April 2022 Alternative Insights publication entitled, "Watch Out for the Balance Sheet," cites an article in the Financial Analysts Journal by Professor Talis Putnins from the University of Technology, Sydney, whereby the author analyzes the expansions and contractions in the Fed's balance sheet relative to price changes in the S&P 500 index for the calendar years 2009 through 2021. His conclusion is that there is a positive correlation of 41.5% between the two data series.
Since peaking in April at $8.9T, the Fed has allowed $381B in assets to mature without reinvesting the proceeds. In other words, they have retired the assets, and with a few keystrokes, removed that liquidity from the financial system. The implication is that they plan to remove an additional $1.14T in liquidity from the system annually until the balance sheet reaches approximately $4.5T. This persistent tightening of liquidity conditions will eventually have the same effect on the economy and corporate earnings as shutting off your sprinkler system would have on your lawn during a drought.
Academic research concludes that it takes about 6-9 months for changes in monetary policy to be fully realized in the economy. The first rate hike occured in March, so we're about to cross the 9-month threshold. During a tightening cycle, its impact is first felt in the interest rate sensitive sectors of the economy including the mortgage lending, real estate brokerage, and homebuilding industries. It then shows up as a slow down in the Manufacturing ISM New Orders index and a steady deterioration in manufacturing PMIs. This is followed by downward EPS revisions shortly thereafter. Ultimately, unemployment begins to rise, leading to weakness in consumer spending, which accounts for about 70% of economic output in the U.S.
So far, we are hitting on all four cylinders. According to Freddie Mac, the national average 30-year fixed-rate mortgage cost has more than doubled to 6.49% from just 3.11% a year ago. As such, it should be no surprise to see that pending homes sales plunged by 36.7% y/y in October, that largest decline on record. Also, the Manufacturing ISM New Orders index was reported at 47.20 for November. A reading below 50 indicates a contraction.
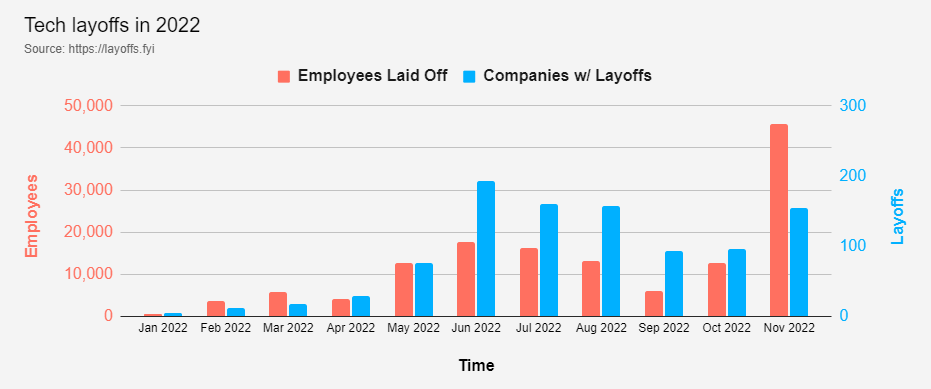
Friday's stronger than expected Non-Farm Payroll Survey report, which exceeded the Household Employment Survey report by about 100,000 jobs, may have been attributable to the birth-death model, according to economist David Rosenberg. Yet, despite all that, even employment, which is usually the last leg of the stool to fall, is already registering early evidence of deterioration in certain growth sectors including Technology, Communications and Consumer Discretionary. According to Layoffs.fyi, a total of 861 tech companies have laid-off 138,012 employees YTD. Meta Platforms, Amazon.com, and Uber Technologies alone have accounted for 20% of the layoffs this year. The word on the street is that Alphabet (GOOG) is expected to announce layoffs of up to another 10,000 employees before year-end.
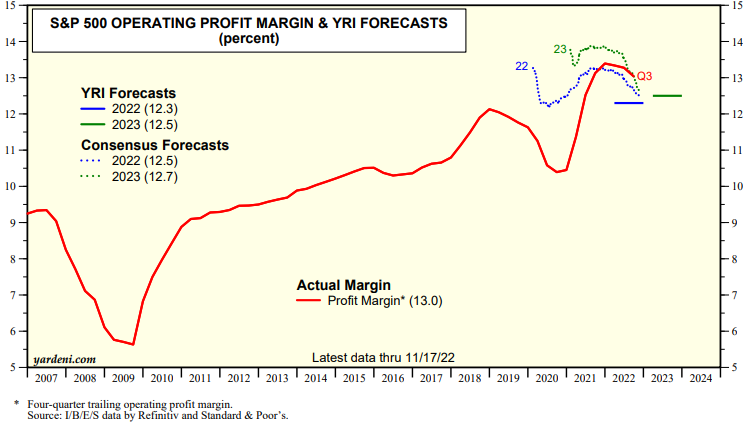
Yet, the most important piece to puzzle -- earnings growth, can be best elucidated by the recent downward revisions to the consensus S&P op-EPS estimates. According to S&P Capital IQ, consensus growth forecasts for calendar years 2022 and 2023 have decline to 5.1% and 3.5%, respectively. That's down from 10.3% and 10.1% at the outset of the year. The majority of the change to the outyear estimate can be attributed to a healthy dose of common sense with respect to operating margin forecasts. Profit margins are the most mean-reverting series in Finance, and the long-term mean is 9.3%. According to Yardeni Research, consensus profit margin estimates for next year have come down to 12.7% from a prior high of 14%.
The result has been a wholesale cut to consensus 2023 op-EPS estimates from around $253 at the end of Q3, to just $231 today. That is a staggering negative revision, especially considering that the street was targeting $264 on January 1st of this year. With most investors cheering over the Fed's recent presumed success on the inflation front, they may want to consider that revenue and earnings are reported in nominal dollars, and that inflation has been a big part of the earnings story in 2022. If the Fed is successful in reversing inflation further next year, then it could have a substantial incremental negative impact on corporate operating results in 2023.
Indeed, the investment strategy team at J.P. Morgan isn't pulling any punches on the subject. Citing weakening demand, deteriorating pricing power, margin compression, and limited stock-buybacks, they recently cut their previous below consensus estimate of $215 for next year by another 9% to just $205. We, ourselves, are currently published at $198 this year, and $193 next year. Our numbers are probably too low for 2022. But if we're wrong about next year, we think our numbers may still prove to be too high!

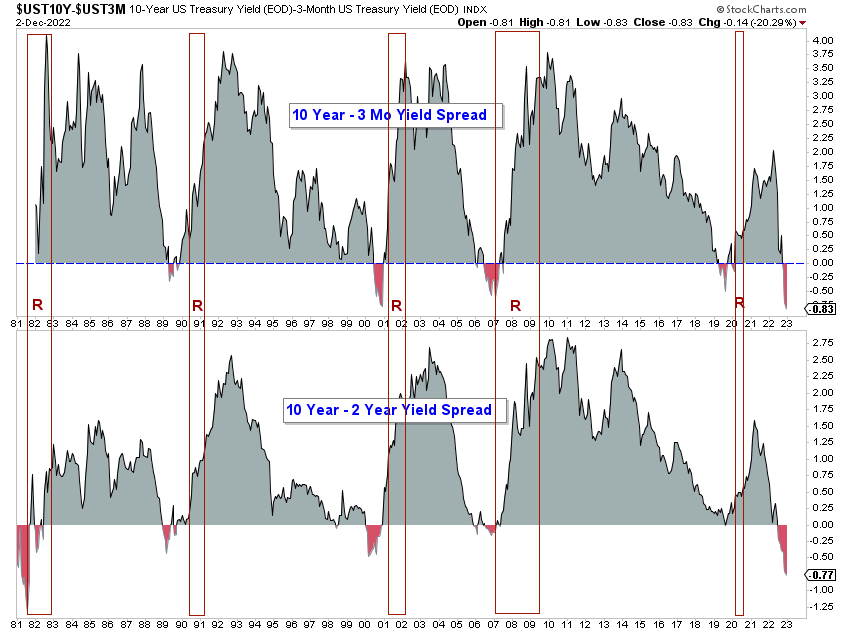
The economic data cited above should be considered convincing evidence of what the yield curve has been telling us all along for months now -- that the U.S. economy is heading toward recession in 2023. While most market observers are aware that an inverted yield curve has preceded every U.S. recession over the past 40-years, do they also know that the recession itself occurs concomitant with the re-steepening of the yield curve? Normally, that's been a function of the Fed cutting rates aggressively in order to stave off the recession. But in this case, considering that the Fed has made it abundantly clear that they are willing to take the U.S. economy into recession in order to crush inflation, we're not so sure that it will playout the same way this time as it has in the past.
We think it's doubtful that the 10-2s spread will invert by double what is did in 1981 while the Fed continues to raise their benchmark lending rate to 5% or more, as advertised. Perhaps, in this instance, long-term rates will rise first, thus steepening the yield curve and creating the deflationary pressure necessary to curb inflation, and eventually reverse it. So, the long-term risk to the economy is not inflation. In our opinion, the long-term risk to the economy is deflation. However, a spike in crude oil prices could shift the balance of risk back in favor of inflation -- but only temporarily. Eventually, high oil prices impair aggregate demand, which leads to deflation, or worse -- stagflation.
The trick for the Fed right now, is to engineer a subtle balance between the two -- the proverbial soft landing. Unfortunately, that is something that the Fed has never, ever accomplished before in its entire history. So, why should it be expected to succeed now?
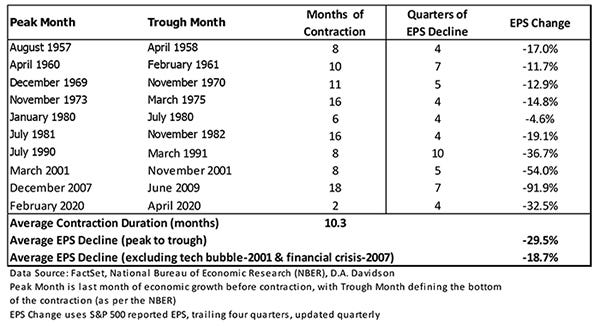
There's something else to consider if you're a pure bottom-up, fundamental investor. If the odds are shifting in favor of a recession in 2023 -- and we think they are, then valuations truly begin to matter. Historically, every economic recessions since 1957 has been accompanied by an earnings recession. According to research produced by D.A. Davidson, the average EPS decline during such periods is -29.5%.
These conditions also suggest that multiple expansion will be very difficult to achieve. Indeed, as Jurrien Timmer of Fidelity Investments has modeled, the forward 12-month (FTM) P/E tends to have a very strong "scaled" correlation to the 2-year Treasury yield. As the yield increases, the FTM P/E declines in a predictable, scaled manner. Based upon the assumption that 2-year Treasury yields lead the Fed funds rate by about 2-3 months, and assuming that the Fed achieves a terminal Fed funds rate of 5.0% as the probabilities above suggest, we conclude that the FTM P/E should bottom in a range of 10-12x FTM op-EPS estimates by the end of 1Q23, and hold there through the end of 3Q23. As such, the implication for the broad equity indexes is dire, to say the least.
Market Analysis and Outlook
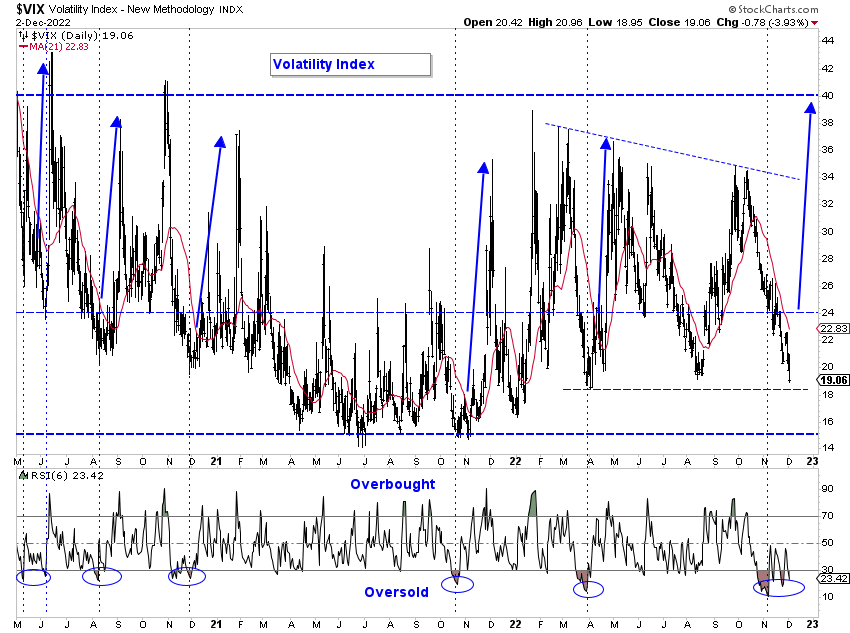
Volatility has recently subsided to levels, which in the recent past, have tended to mark short-term highs in the major averages. While this does not guarantee a near-term market top, it increases the odds dramatically that the stock market is poised for a trend reversal to the downside. In our view, a daily close back above the 21-day moving average on the VIX would be the first piece of evidence to support this supposition. A weekly close back above 24% on the VIX -- a level that has typically coincided with the "boiling point" for volatility since March of 2020, would confirm it.
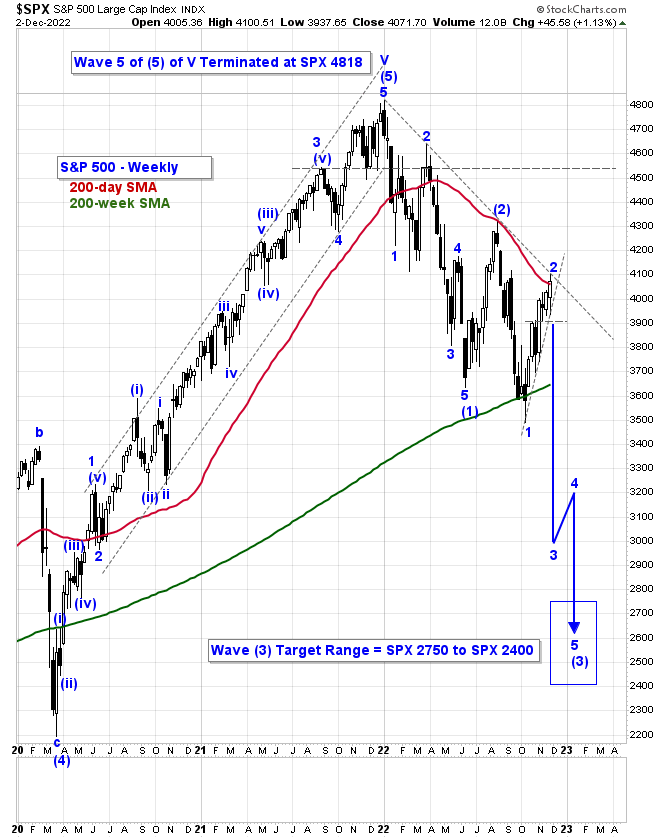
We continue to believe that the January 4th peak in the S&P 500 index most likely marked the end of cycle wave V, and by extension, the end of a supercycle wave (III) advance that began some 90 years ago. If so, then a fourth wave correction at supercycle degree of trend is now operative and should take years to unfold.
Since the initial foray to the downside traced out a clear five wave decline, we know with a high degree of confidence that the June low marks the beginning of a trend change of at least cycle degree, which at minimum, should retrace between one-third and two-thirds of the preceding cycle degree advance off the March 2009 low. Therefore, there are only two possible outcomes to consider. We'll refer to them going forward as our preferred count and our alternate count.
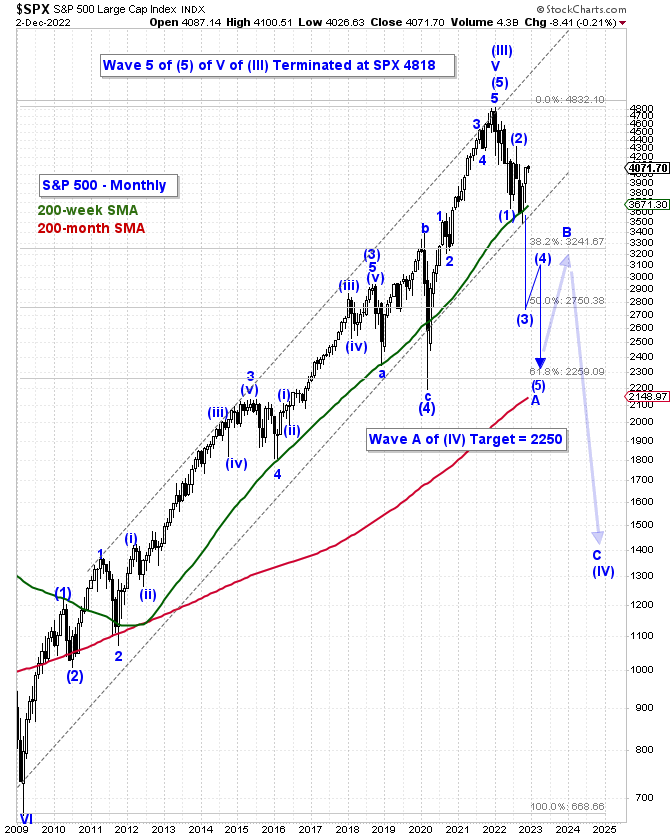
Under the preferred count, primary wave (1) down, of cycle wave A down, terminated on June 17th at SPX 3637. This was followed by primary wave (2) up, a countertrend advance, that subsequently terminated on August 16th at SPX 4325. If this view is correct, then primary wave (3) down is still tracing out its early subdivisions. We've labeled the October 13th low as intermediate wave 1 down, and the December 1st high as potentially marking the top of intermediate wave 2 up, of primary wave (3) down. So far, this entire sequence is only part of a motive wave (an impulsive five wave decline) that should eventually carry the index to approximately SPX 2250 before cycle wave A down terminates.
In recognition of the fact that we cannot see the future with certainty, but can only anticipate it under the probabilistic framework of the Elliott Wave principle, the alternate count assumes that cycle wave A down is not tracing out a motive wave [(1)-(2)-(3)-(4)-(5)] at primary degree of trend, but is instead tracing out a corrective wave form [(A)-(B)-(C)].
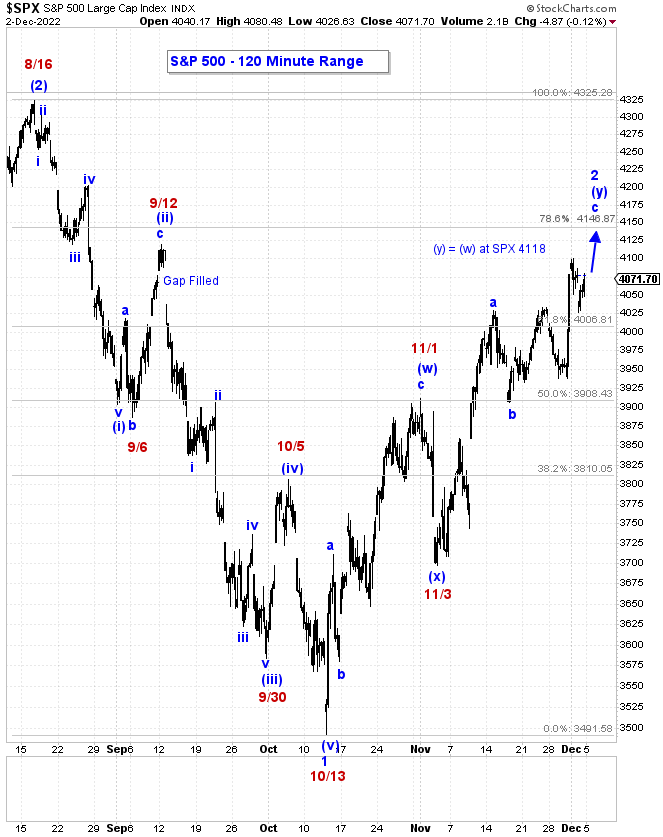
In this case, we assume that the June low marked the end of primary wave (A) down of cycle wave A down. Thus, the entire sequence since the June 17th low is likely part of a more complex corrective wave form known in Elliott Wave parlance as a "flat." A flat correction differs from a zigzag in that the subwave sequence is [3-3-5] and it evolves as a broad, lateral consolidation of the previous wave sequence.
Under this rubric, the August 16th high would mark the end of intermediate wave A up, of primary wave (B) up. Hence, the October low, which closed just slightly below the terminal point of the previous wave sequence -- as is typical with a flat, would then mark the end of intermediate wave B down, of primary wave (B) up. To then complete the sequence, the move off the October low -- intermediate wave C up of primary wave (B) up, must trace out an impulsive five wave advance to terminate slightly beyond the intermediate wave A high. A typical price target for a flat is the Fibonacci 61.8% retracement level of the previous wave sequence. That would put the upside potential for primary wave (B) at SPX 4365. Primary wave (C) down should then follow expeditiously, and carry the index to a level that equates to at least 1.618x the magnitude of primary wave (A) from its origin. We estimate that level would equate to approximately SPX 2440.

So, how will we know which of these two counts is operative? Frankly, it matters little to our big picture view. Both counts are equally bearish. The alternate count simply allows for a slightly higher corrective advance than our preferred count (~ 5%).
That being said, with respect to our preferred count, a sustained close below SPX 3906, the November 17th low, would be the first strong indication that intermediate wave 3 down, of primary wave (3) down was in progress. A break below SPX 3491, the October 13th low, would confirm that a "third-of-a-third" wave decline was underway, targeting the SPX 2750-2400 range to terminate primary wave (3) down.
As for the alternate count, if prices were to close sustainably above SPX 4147, the Fibonacci 78.6% retracement of the August-October decline, then we would have to strongly entertain the possibility that the alternate count was in play. At present, we ascribe a much lower probability to the alternate count than to the preferred count.
Conclusion
To be sure, the outlook for the economy, corporate earnings, and the stock market remains grimm in our view. The price action off the October lows has been frustrating to the bears, but there are many reasons to doubt the validity of the bull case. Based upon our 32 years of professional experience studying and trading markets, we remain unconvinced that the current advance is anything more than a dramatic bear market rally. Second waves and B waves are what R.N. Elliott described as, "sucker plays, bull traps, speculators' paradise, orgies of odd-lotter mentality, or expressions of dumb institutional complacency." The point of countertrend rallies is to convince the inexperienced that the bull market has resumed, so that the experienced can get out before the next leg down ensues.
We have not been suggesting that investors attempt to short this bear market, rather we have been advocating that investors sit on the sidelines and wait it out. But as the late, great Tom Petty wrote, "The waiting is the hardest part." Fortunately, you can get paid pretty well these days just to sit in cash and wait. Treasury securities the 1-3 year maturity range currently yield between 4.0% and 4.6%, risk-free. That's nearly half the S&P's long-term average annual return. In our opinion, short-term Treasuries currently offer the best combination of safety, liquidity, and income. During a bear market, it's a good place to park 80-90% of your investment capital.
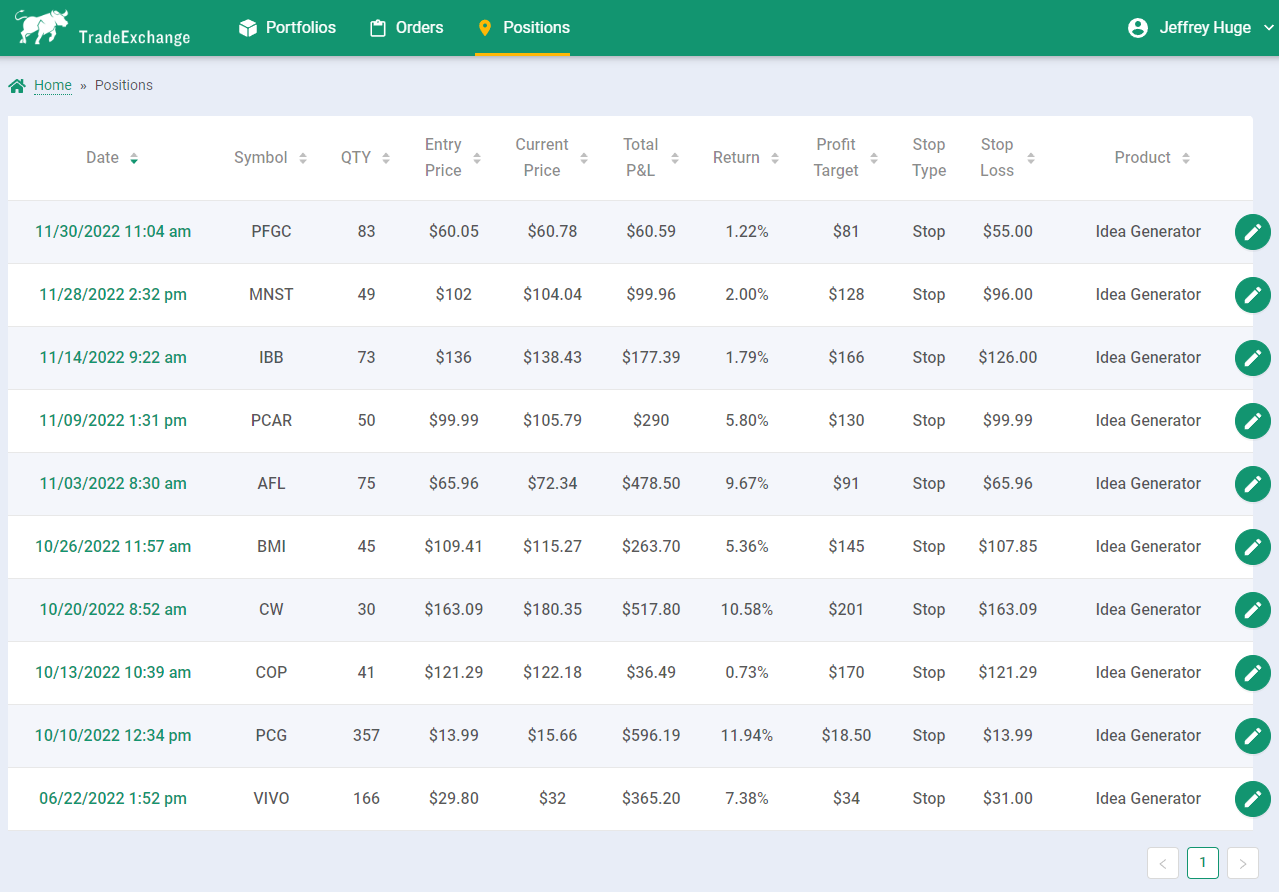
As for the other 10-20%, keep it liquid in a government securities money market fund or an FDIC insured savings account, and ready to be deployed when trading opportunities present themselves. And there are always trading opportunities! Below are the details of some of the swing-trade ideas that we've presented to our members in recent weeks and remain open today in our live, Idea Generator, trading account. Some are up double-digits in just a matter of weeks. Newer trades are just starting to take-off.
For those who have difficulties finding such trading opportunities in a timely manner, or for those who simply have an interest in seeing regular idea flow, our ALPHA INSIGHTS: Idea Generator Lab publication, is available to newsletter members for just $10/month. The publication highlights our top actionable trade idea each week, and is delivered to your inbox every Wednesday afternoon between 12:00-1:00 pm CST via e-mail. That’s four ideas a month for $10 – each costing less than the price of a cup of coffee at Starbucks! Is it worth it? You tell us.
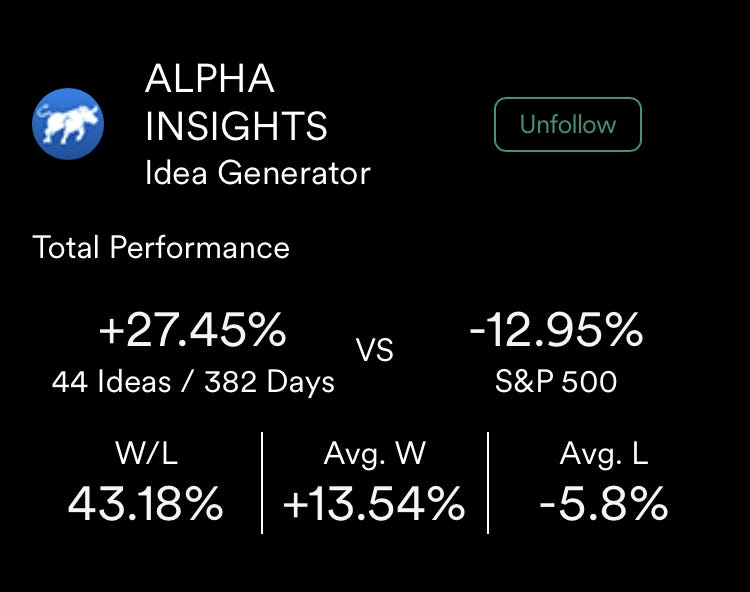
Our third-party verified performance, as of the close of business on December 2nd, is presented below. It details our total returns vs. the S&P 500 since inception (11/15/21). Trading on the long-side during a bear market is more difficult than during a bull market, but of the 44 trade ideas that we’ve presented over the past year or so, about 2 out of 5 have paid off. But, when we’re right, we’ve made over three times as much on our closed trades as we’ve lost when we’re wrong. That formula has allow us to post a +27.4% positive absolute return on total capital deployed over that time, and a +40.4% positive relative return vs. the S&P 500 index, which has declined by about -13.0% during the same period.
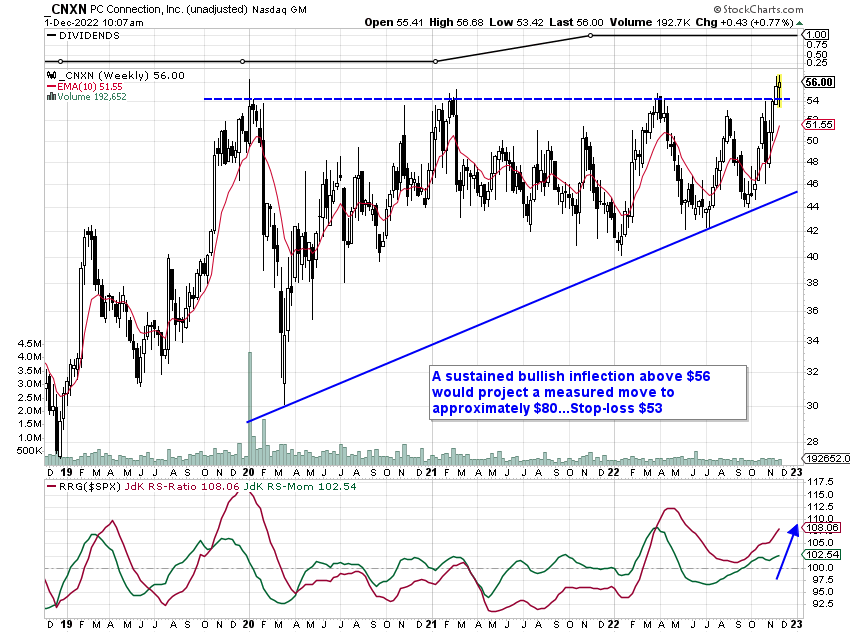
Below is a recent example of a trade idea presented to our members just a couple of days ago. We identified a small-cap company, based in Merrimack, NH by the name of PC Connection (CNXN). The company specializes in providing customized IT solutions to small-to-medium sized businesses, governments, and educational institutions through outbound field sales and marketing programs. They run a low overhead business model and make it easy for their customers to buy and implement end-to-end IT solutions at a firmwide scale resulting in both cost savings and productivity gains.
After reporting strong quarterly results, the stock recently posted a new all-time record high to resolve above the upper boundary of a classic lateral consolidation pattern of the "Barrier Triangle" variety. A sustained bullish inflection above $57 would confirm the breakout and project a measured move to approximately $80/share.
We would be looking to enter into long position using a buy-stop order on a breakout to new highs. We see an opportunity for swing-traders with a 1-3 month time horizon to capitalize on a move that could carry the stock to our published price target of $80 for a potential 40% gain. An initial stop-loss set at $53 would establish a very attractive 5:1 positive risk skew, and limit downside risk to just $4/share, or about 7% of capital deployed based upon a $57 entry price. For this trade idea, we would suggest limiting your position size to less than 5% of trading capital, or about 1% of total investment capital (assuming that 80% of the portfolio is allocated to short-term Treasury securities).
If you like this type of idea flow – one top actionable trade idea, once a week – then maybe you should consider trying our membership option below. There’s no long-term commitment or contracts. If it’s not for you, then it’s not for you – cancel anytime.
To get full access to our ALPHA INSIGHTS: Idea Generator Lab publication, which includes our top stock or ETF idea each week, become a dues-paying member for just $10 a month by clicking here.
Disclaimer
All information and data contained on this site and in reports, analytics, etc. produced by Jeffrey W. Huge (the “author”) is for informational purposes only. The author makes no representations as to accuracy, completeness, suitability, or validity, of any information. The author will not be liable for any errors, omissions, or any losses, injuries, or damages arising from its display or use. All information is provided AS IS with no warranties, and confers no rights.
External links are often provided within the author’s newsletter for the convenience of the reader. The author will not be responsible for any material that is found at the end of these external links.
The author is NOT registered as a securities broker dealer or investment adviser with either the U.S. Securities and Exchange Commission or with any other state or federal securities regulatory authority.
The content of the author’s newsletter should not be considered professional financial investment advice. The ideas and strategies should never be used without first assessing your own personal and financial situation, or without consulting a financial professional. The author may hold positions or other interests in securities mentioned, including positions inconsistent with the views expressed.
The user bears complete responsibility for their own investment research and should seek the advice of a qualified investment professional before making any investment decisions.
Past performance is no guarantee of future results.