

HUGE INSIGHTS: The Big Picture - Issue # 17
2023 Investment Outlook

Please enjoy the free portion of this monthly newsletter with our compliments. To get full access, you might consider becoming a paid subscriber. As an added bonus, paid subscribers also receive our ALPHA INSIGHTS: Idea Generator Lab publication every Wednesday, which details our top actionable trade idea each week.

The original Top Gun film, starring Tom Cruise, was released in the Spring of 1986. We were a mere 21 years of age back then, and stood in line for hours to see it on opening day. It did not disappoint. At the time, we were utterly blown away by the live aerial combat footage and carrier scenes. This year’s reboot, Top Gun: Maverick, bested it in our opinion. Thirty years after graduating from Top Gun combat training, Captain Pete “Maverick” Mitchell must lead the latest crop of the best-of-the-best on a daring mission, the success of which is paramount to the future of national security. But in order to prevail, he and his Top Gun students must overcome an array of obstacles that requires each of them to push their F/A-18 Super Hornet aircraft to the absolute edge of the envelope.
Among these required maneuvers, is an inverted dive from the crest of a mountaintop, which allows the pilots to maintain the lowest possible altitude in order to avoid radar detection from surface-to-air missile batteries during their bombing run. Once their incendiary payloads are deployed, the pilots are then required to immediately go vertical, pulling nearly 9G’s in order avoid hitting the side of a mountain and escape the blast. It was described as an impossible feat for an F/A-18 — until Maverick proved that it could be done. The key to success, as Maverick puts it, is not dependent upon the aircraft, but the “pilot in the box.”
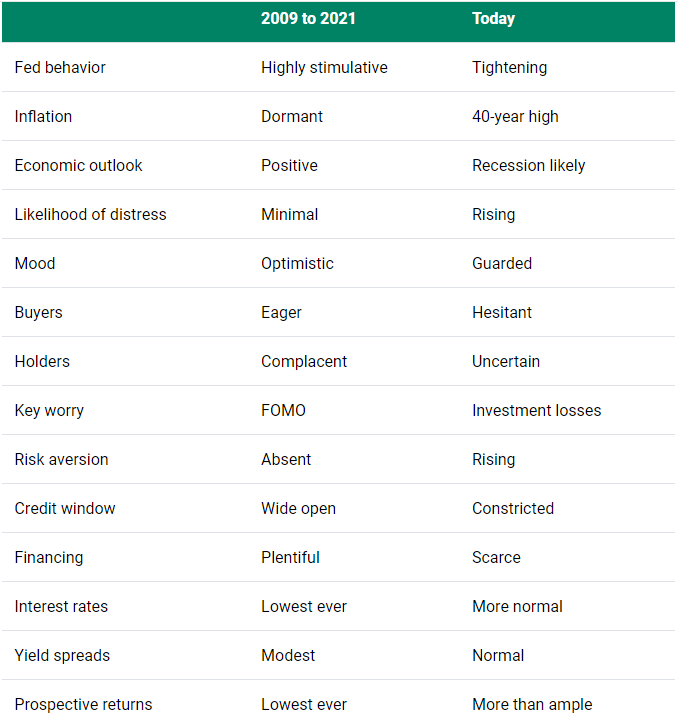
As illustrated in the cartoon above, the stock market is already in an inverted dive, down nearly 20% from its high, and the bulls don’t appear to realize the gravity of their situation. They’re still putting their faith in a Federal Reserve Chairman, who like the crash test dummy above, continues to give them the thumbs-ups everytime the air gets a little bumpy. But the success of their mission requires a nearly impossible maneuver. The bulls must pull out of this dive and then go vertical. Yet, the 9G’s required to avoid hitting the side of the mountain equates to massive overhead resistance, and the pilot in the box is not Maverick, its Jerome Powell.
Economic Conditions & Monetary Policy
Both the headline and core CPI inflation data continued to cool in November, which on the surface was a welcome relief. According to numerous accounts, we’re told that if we just annualize the last three months of data, the CPI is now running at close to 2.5%. Indeed, the all important core PCE report — the Fed’s preferred inflation gauge, came in at a better than expected 4.7% for November, down from 5.0% a month earlier. But for some reason, the market did not cheer the news. In fact, 10-year Treasury yields have begun to trend higher since posting a recent low of 3.4% on December 7th. As of year-end, they are up about 48 bps.

Perhaps the market recognizes that there is something in the data that is not quite right. The chart above might help fill in the blanks. The so-called Sticky Price CPI is calculated from a subset of goods and services within the CPI whose prices change relatively infrequently. This measure as calculated by the Federal Reserve Bank of Atlanta remains at a stubbornly elevated level of 6.5% and has yet to deliver a downtick. In addition, the PPI report actually ticked up in November to 0.3% vs. 0.2% in October. But perhaps the most concerning economic report of the past month was the November NFP report, which showed that despite the most aggressive monetary tightening cycle in the past four decades, the economy is still creating new jobs at a breakneck pace, while workers continue to command ever-higher wages.
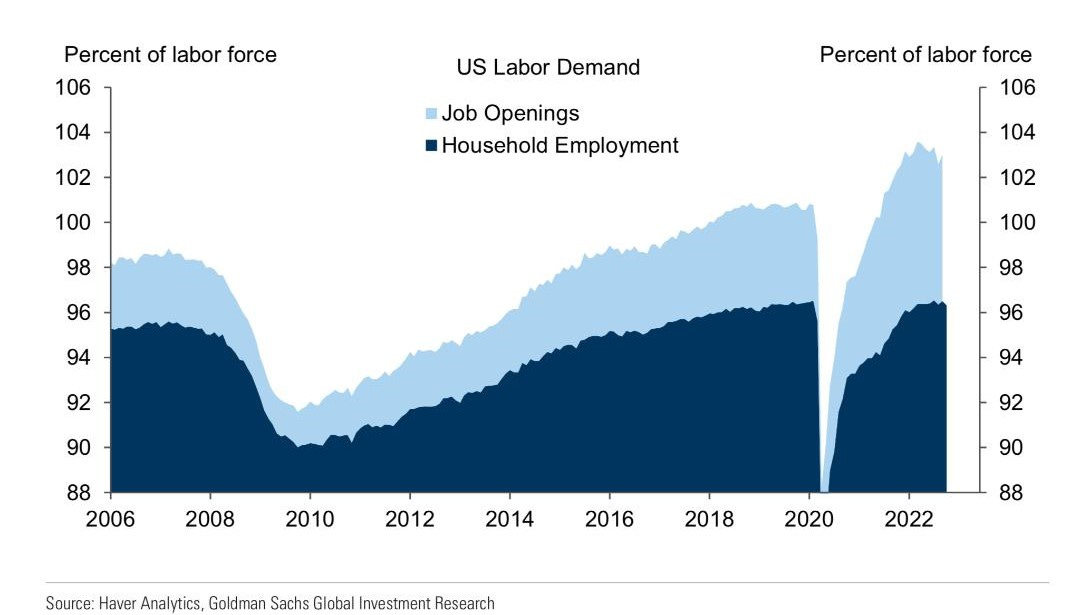
This last point has the Fed’s full attention. That’s because they know that the longer this condition remains in place, the more likely it is that rising inflation expectations will begin to take root. As a result, the Fed has decided to take of the gloves off with respect to wage inflation. The so-called “dot plot,” which illustrates the latest assessments of appropriate monetary policy from the FOMC participants, shows that the consensus view at the Fed now puts the terminal Fed funds rate between 5.00-5.25% by mid-2023. In addition, Chairman Powell, along with a cadre of other Fed governors, have turned up the volume on their “higher for longer” rhetoric, suggesting that there will be no Fed pivot during the next calendar year. Furthermore, they have made it crystal clear that they are prepared to put the economy into recession if necessary in order to vanquish inflation for good. We think they mean it.

So what could go wrong? Well, a lot actually. For starters, the Fed has no control over the price of oil. Given that the Biden administration has already drained the nation’s strategic petroleum reserve (SPR) by nearly 50% to a new forty year low of just 350MM/bbls, it’s very unlikely that the equilibrium price for WTI crude will be manipulated to the downside by the U.S. government in 2023. In fact, they’ve announced a repurchase plan. As such, in the absence of increased domestic production, and an immediate end to the war in Ukraine and subsequent removal of sanctions on Russia, OPEC is the global swing producer, and they’ve already cut production by 2MM/bbls/day in defense of their $80/bbl. price floor on Brent crude.
Moreover, even if Russia is allowed to return to the market uncapped, their production capacity has been reduced over the past year and may be permanently impaired. According to Bloomberg, Russia is now planning to cut their 2023 production by as much as 700K/bbls/day in 1Q in response to the price cap. Some industry experts have speculated that this could even be cover to disguise a more serious structural problem within their undermanned fields and ill-maintained production infrastructure, which has suffered as resources have been diverted to the war in Ukraine, and GDP has collapsed.

Of course, the real wild card remains China. The removal of their Zero-COVID restrictions may not result in an immediate restart of the Chinese economy. But eventually, if/when a restart is successful, then the subsequent demand-side pressure could be enough to tip the scale, pushing crude prices back toward the $100/bbl level by the end of the first quarter. Since Venezuelan oil production aggregates to just 2.3MM/bbls/day, the U.S. will need to make a decision at some point to either defer or abandon its green energy ambitions, and instead incentivize increased domestic production, or live with higher crude prices until the world can rebalance supply to meet a more normalized demand environment.
Obviously, the timing of this could not be worse. With U.S. inflation metrics already persistently above the Fed’s 2% target, monetary conditions are poised to remain tight for at least the next year. Yet, the impact on GDP growth is still unknown. Following a 450 bps increase in the Fed funds rate, and a 4.3% reduction in the size of the Fed’s balance sheet in 2022, real GDP in the fourth quarter still appears on track to grow at a robust 3.7% annualized rate.
While 2022 real GDP growth is likely to print around 1.8% for the full year when it’s ultimately reported, the consensus view among Wall Street economists is for a decline to just 0.4% growth in 2023, according to Bloomberg. This outcome seems optimistic, given that past restrictive policy shifts have historically tended to effect growth to a greater magnitude, albeit with long and variable lags. How long? Empirical data suggests that it takes between six and twelve months for the initial policy action to begin to take effect. As it has now been over six months since the first 150 bps of tightening, we should soon start to see its effects begin to filter through the broad economy.
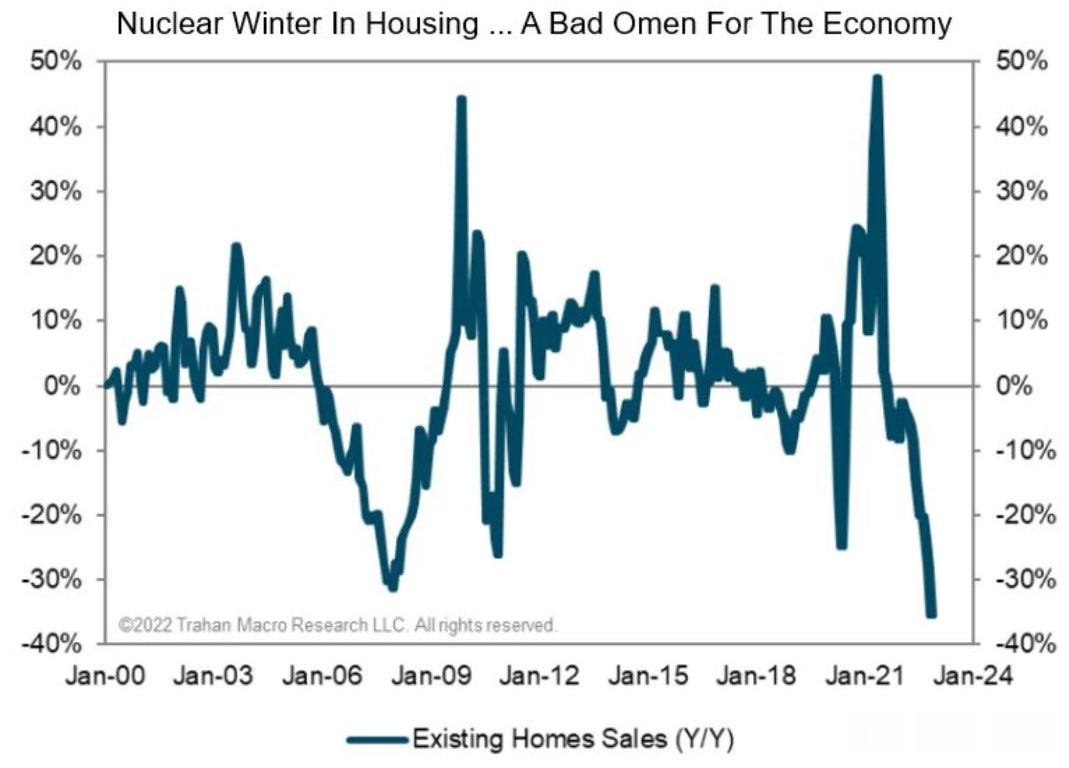
Yet, there is no doubt that the credit sensitive areas of the economy have already taken a few pioneer arrows in this unprecedented rate cycle. Housing, for one, appears to be in its own recession. Indeed, the Y/Y decline in existing home sales for 2022 is now worse than that witnessed during the great financial crisis (GFC) back in 2008! With rates now trending higher, this condition is unlikely to reverse meaningfully in 1Q23. Many of those who bought when mortgage rates were at their lows, especially on the East and West coasts, likely overpaid for their homes. And while they can take some solace in the fact that they locked in an historically low fixed mortgage rate, they may not be able to sell their home for years without losing significant equity.
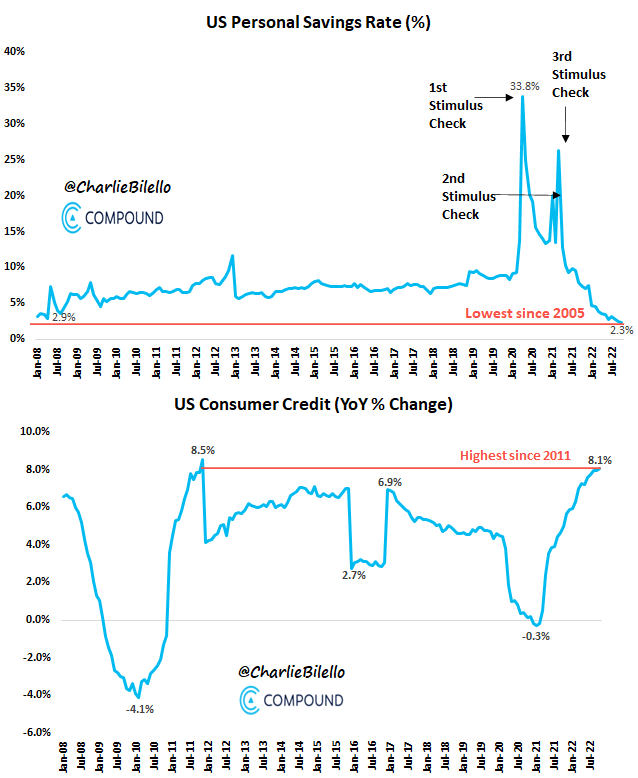
But not to worry, right? Jobs are plentiful and everyone says the consumer is in great shape. Wrong. While overall consumer spending in nominal dollars has held up better than expected over the past year, real Y/Y retail sales have imploded. Meanwhile, the Personal Savings Rate has reached its lowest level since 2005 concomitant with Consumer Credit growth rising to its highest level in over a decade. Conclusion: The U.S. consumer is tapped out. Moreover, as mentioned above, rising oil prices remain a key risk to consumer spending — and by extension, the economy. The SPR drain temporarily lifted the taxing effect of higher prices at the pump last year, but that may not be repeatable. If average gasoline prices were to drift to back above $4/gallon for a sustained period of time in the next year, that could be enough to tip the scale toward a full-on recession in the U.S.
A Bloomberg Economics model now implies a 100% probability of recession by August of 2023. Whether or not there will be a recession in 2023 is a tough call to get right. We’re not certain one way or the other, but it might not matter. Things could get just bad enough that is feels like a recession, even if the NBER doesn’t officially label it as so. One reason to remain cautious about the economy is the yield curve. Presently, the spread between the 2-year and the 10-year Treasury yields remains deeply inverted, as does the spread between the 3-month and 10-year yields. An inverted yield curve has preceded every recession over the past 50 years.

To quote our old friend Harley Bassman, creator of the MOVE index, “It’s a stone cold fact that the yield curve is the best predictor of a recession.” But while the the yield curve may have a perfect track record when it comes to predicting a coming recession, it’s not that great at pinpointing the exact timing of said outcome. The variability between the signal and the recession since 1970 has ranged between 10 and 33 months.
A Sea Change is at Hand
Distressed asset investor Howard Marks, of Oaktree Capital Management fame, is well-known for his thoughtful quarterly letter to investors. Yet, none in our opinion rivals the importance of that which was published on 12/13/22 entitled, Sea Change. In short, Marks details the “radical” shift underway within the economy, the capital markets, and the attitudes of investors over the past year, as compared to the prior 13 years — if not the last 40 years, as monetary policy transitions from a tailwind to a headwind.
Marks nails it in our opinion. In a most eloquent discourse, he lays out the very case that we have been struggling to articulate for the better part of this year. And while his insights, which are based upon considerable experience, appear to be spot on, we noticed that there was something missing. And what he missed is likely to be of equal importance. In our opinion, Marks fails to recognize that this sea change could result in more than just a new plateau. Like prices, economic conditions trend. And when an unsustainable 13-year trend of easy monetary policy reverses, the pendulum often swings with equal force in the opposite direction.

Take the money supply for example. Real M2 Money Stock in the U.S. has declined by 6.6% Y/Y through month-end November. That’s the largest Y/Y decline on record going all the way back to 1959. But, what’s more important in our view, is that this decline follows another heretofore unprecedented extreme that occurred on the upside, when the series grew by 24.7% Y/Y during the pandemic shut down. Logically, one could deduce that a move in one direction that peaked around 150% above the prior extreme, might be followed by a move in the opposite direction that overshoots the prior extreme by a similar proportion on the downside.
One potential that we believe is being ignored by the Wall Street consensus is one where the improvement in the inflation data of late is not just a welcome reprieve, but instead a prelude to deflation. As we’ve discussed in these pages before, we suspect that the real problem with the global economy is not inflation, but deflation. Prior to the advent of the pandemic, and the war in Ukraine, most developed economies were experiencing disinflation, and to varying degrees, deflation. According to MarketWatch, as much as $16.5 Trillion of global sovereign debt had been priced with a negative yield as recently as August 2021. The fundamental reason for the underlying problem of deflation is probably the result of a structural decline in the birth rate in most developed countries. This demographic shift has created a deeply rooted problem for aggregate demand throughout the developed world. The global central bank response to “post-pandemic, war-related” inflationary conditions, which were probably always temporary in nature, could be sowing the seeds of a future deflationary crisis.
Valuation & Earnings
Total U.S. Market Cap-to-GDP closed the year at 146.6%, well-below the January all-time record extreme of 209.4%, but still above its prior secular peak of 142.9% recorded in March of 2000. In addition, the Shiller cyclically-adjusted Price-to-Earnings ratio closed the year at 27.8x vs. its recent cycle high of 38.6x, and a historical average of 17.3x. The S&P 500’s Dividend Yield continues to plumb its historical lows — currently 1.71%, while its Price-to-Sales ratio is a bloated 2.3x — down from an all-time record high of 3.0x, but still above the March 2000 extreme of 2.1x. Price-to-Book Value is now 3.8x, below the 2000 peak of 5.0x, but more than double the 2009 trough of 1.7x. To say the least, it does not appear that the market is pricing in an imminent recession next year.

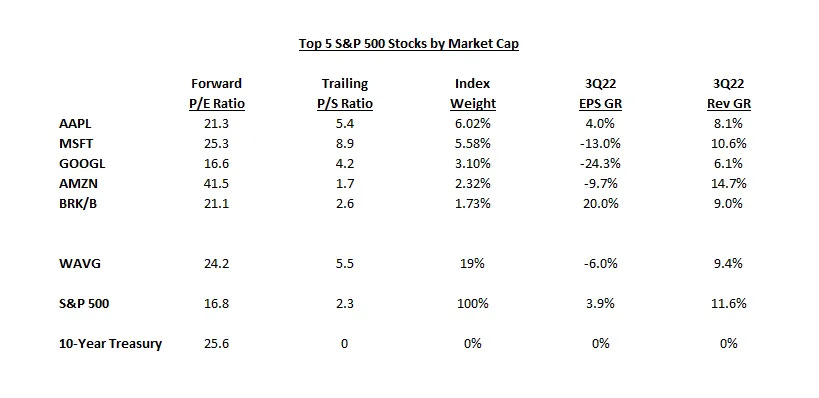
Notably, despite losing a quarter of their value on average, the five largest companies in the S&P 500 index by market cap still remain very expensive relative to both the broad market and the 10-year U.S. Treasury note. However, the valuation premium between the “Fabulous Five” and the market has receded from over 100% in mid-August at a FTM P/E of 41x, to about 44% at year-end with a FTM P/E of now 26x. The progress is further evidenced by the Fab Five’s decline from nearly 23% of S&P market cap to just 19% of S&P market cap over the same period. Yet, if one considers the group’s relative 3Q22 operating performance, that progress may seem insufficient.
To be sure, all of the above will remain little more than academic if sales and earnings fail to live up to expectations. S&P Global has consensus S&P op-EPS estimates for 2022 holding in at just under $220 as of December 23rd. However, consensus 2023 estimates have continued to plummet to now $226. That’s down from $252 just six months ago, and implies less than 3% nominal growth over the next year. But a few Wall Street strategists are even less sanguine about the year-ahead. According to Sam Ro at Yahoo! Finance, as of December 4th, Morgan Stanley has a published base case estimate of $195 for next year. So does Deutsche Bank. UBS is at $198; RBC is at $199; BofA is at $200; and JP Morgan is at $205. While the jury is still out, our $198 estimate for this year is probably too low, but our 2023 estimate of $192 may yet prove to be too high. Time will tell.
Consensus S&P op-EPS Estimates

Importantly, while there has been a good deal of discussion in the media regarding Wall Street’s new bearish consensus outlook for 2023 -- a first since at least the year 2000, it’s not unfounded. These folks aren’t shoe shine boys or cab drivers. They’re the Top Guns of Wall Street. And while they may be a little late to the party, that doesn’t make them wrong. Indeed, the closer in time that we come to realizing an event, the more the consensus zeros in on reality. One question remains, why isn’t the market listening?
Geopolitical Risks Remain High
While Russia’s invasion of the Ukraine has dominated the geopolitical stage over the past year, China continues to remain our key concern. Having visited China in 2007, we saw first hand just how restricted their society is with respect to access to information and how controlled the message is through widely distributed propaganda. China truly is a living example of George Orwell’s, 1984. Xi’s zero-COVID policy was only the latest example of the heavy-handed social controls imposed upon the Chinese populace by the CCP.

Importantly, the advent of Xi Jinping’s unprecedented third term as China’s President, and his stacking of the politburo with hard line CCP supporters with military ties, solidifies his control and implies a new potential threat of foreign policy adventurism. In that vein, the reunification of Taiwan remains high on Xi’s list of priorities. Hostile rhetoric toward the U.S. regarding its support for Taiwan’s independence, from various high ranking CCP members — not to mention Xi himself, suggests that the time may be fast approaching for China to make its move on Taiwan.
Recall that over 70% of the world’s semiconductor chip capacity resides in Taiwan, where 92% of the world’s most technologically advanced chips are manufactured for use in communications, aviation, and a variety of U.S. military applications. Taiwan is the center of the global economic chessboard. We know it. They know it. Whoever controls Taiwan, will dominate the global economy for at least the next five years.
But, while China’s ambitions in Taiwan represent a potential emerging threat to U.S. economic and national security interests, Russia continues to remain the primary threat to geopolitical stability. The war in Ukraine is not going well for Russia. Putin has completely isolated his country from international trade and finance with the West. The price-cap on Russian oil exports has made it unprofitable to maintain production quotas. The performance of Russia’s military has been an international embarrassment at best, and a display of incompetence at worst. Their army appears unmotivated and poorly trained. Their equipment appears obsolete and in disrepair. And their tactics, while brutal, have proven ineffective. A defeat of Russia by Ukraine, while incomprehensible nine months ago, appears to be a foregone conclusion today.

The primary risk here is that Putin becomes trapped and is forced to escalate the war just to save face. The U.S. decision to further support Ukraine, following President Volodymyr Zelenskyy’s overwhelmingly popular visit to the White House and Capitol Hill, could prove problematic. The administration is currently contemplating providing the Patriot missile defense systems and Bradley armoured fighting vehicles to help shore-up Ukraines defenses. Putin has made it clear that Russia would consider such a move by the U.S. to be an escalation of the conflict to the status of war with NATO. The ultimate risk remains that Putin acts on his threat to use nuclear weapons in order to achieve his goals — whatever they may be.
Market Analysis & Outlook
We can’t predict what the future holds with respect to the aforementioned geopolitical considerations. They are food for thought at best. As for the economic and earnings outlook, we are better informed, and more qualified to comment, but our opinions are just that, opinions. We have no foresight into the future here either. No one does. But our analysis of the data as presented above leads us to conclude that things have the potential to get significantly worse before they get better. Our edge comes from employing the disciplines technical analysis, trend-following, and in evaluating the market’s price action through the lens of the Elliott Wave Principle. Our analysis concludes that the bear market of 2022 remains in full force going into 2023. Below are the details of that analysis.
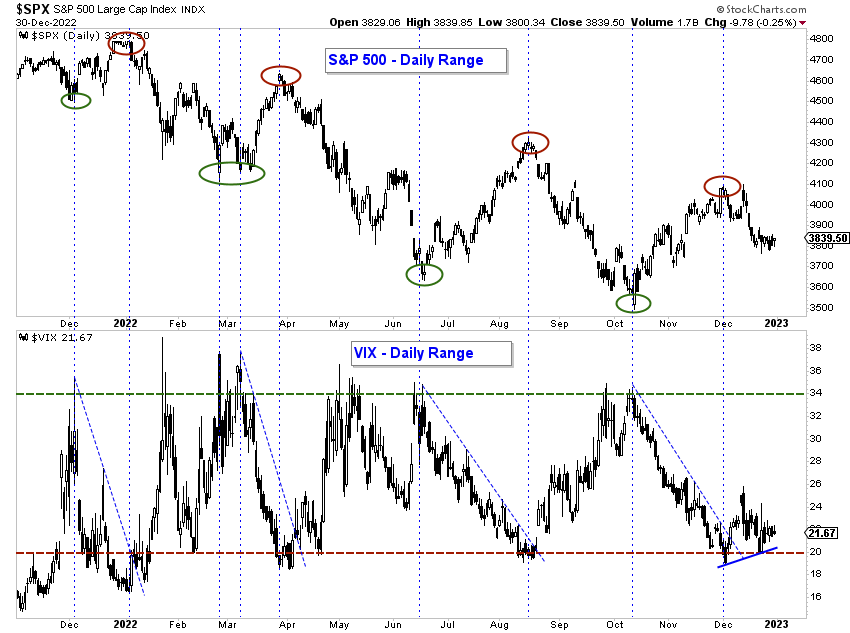
As illustrated in the chart below, negative momentum divergences have attended each important market turning point throughout the past year. Our old colleague Tom Fitzpatrick, the FICC Technical Analyst at Citi, coined the term “triple negative divergence,” which he used to describe the condition that existed when the price of a particular instrument made a series of three sequential higher highs, while the momentum of said instrument posted a concomitant series three sequential lower highs. It was his opinion, that a triple negative divergence was most likely to occur before a major reversal in the price trend. This very condition developed into the December 13th intraday high on the S&P 500. Here we are only twelve sessions later, and the S&P has already traded down some 200 handles into the recent lows.

Another consideration is the relatively stable relationship this year between the S&P 500 index and the CBOE Volatility index (VIX). Each time the VIX has reached a level that exceeds 34%, it has very nearly marked each tradable low for the S&P. And when the VIX has reached a level below 20% - - and then reverses above its descending trendline, it has coincided very closely to each of the four major highs in the S&P this past year. The VIX posted a low of 18.95% on December 2nd. It has since reversed above its descending trendline. Importantly, as the S&P put in its recovery high on December 13th, the VIX posted a higher low. That positive divergence suggests that volatility is poised to accelerate to the upside. We expect the VIX to spike higher as stock prices resume their decline in the new year. We think that it is quite likely the the VIX will exceed 40% in the next interval, a level not witnessed in over two years.
As discussed in prior issues of this publication, we continue to believe that the January 2022 peak in the S&P 500 index most likely marked the end of cycle wave V, and by extension, the end of a supercycle wave (III) advance that began some 90 years ago. If so, then a fourth wave correction at supercycle degree of trend is now operative and could take several years to unfold.
Since the initial foray to the downside traced out a clear five wave decline, we can say with a high degree of confidence that the June low likely marks the beginning of a trend change of at least cycle degree, which at minimum, should retrace between one-third and two-thirds of the preceding cycle degree advance off the March 2009 low.

Our preferred Elliott Wave count at cycle degree of trend supports the conclusion that the S&P 500 is in the early subdivisions of primary wave (3) down, of cycle wave A down, within a supercycle wave (IV) correction. A break below SPX 3491 would confirm that view, suggesting that prices are potentially in the midst of a “third-of-a-third” wave decline. Third waves are usually the most powerful and dynamic wave within the impulse wave sequence [(1)-(2)-(3)-(4)-(5)]. They have a tendency to subdivide and extend, concomitant with strong momentum. The point of peak momentum usually occurs at the midpoint and have been observed in combination with continuation gaps, volume expansions, and extraordinary breadth. R.N. Elliott had this to say about third waves: “They are wonders to behold.”

Under our preferred count, primary wave (1) down, of cycle wave A down, terminated on June 17th at SPX 3637. This was followed by primary wave (2) up, a countertrend advance, that subsequently terminated on August 16th at SPX 4325. If this view is correct, then primary wave (3) down is still tracing out its initial subdivisions. We’ve labeled the October 13th low as the end of intermediate wave 1 down, and the December 13th high as the end of intermediate wave 2 up. So far, this entire sequence since the August 16th high is only part of an impulsive five wave decline [1-2-3-4-5] that should eventually carry the index into the SPX 2750-2400 range to complete primary wave (3) down. Primary wave (3) down will be followed by primary wave (4) up, a countertrend advance. Based upon Elliott’s theory of alternation, since primary wave (2) was a steep and extended zigzag, primary wave (4) should trace out a shallow lateral consolidation pattern — most likely a triangle or a flat.
Once finished, primary wave (5) down will follow with a thrust to new lows to terminate cycle wave A down. Our cycle wave A target is SPX 2250, where the Fibonacci 61.8% retracement of the cycle wave V advance off the 2009 low coincides with a prior fourth wave extreme at one lesser degree of trend, and the rising 200-month SMA. Once completed, cycle wave B — a countertrend advance, should then retrace between one-third and two-thirds of the expected cycle wave A decline before cycle wave C ensues. Cycle wave C should carry the index significantly lower to complete the supercycle wave (IV) correction.
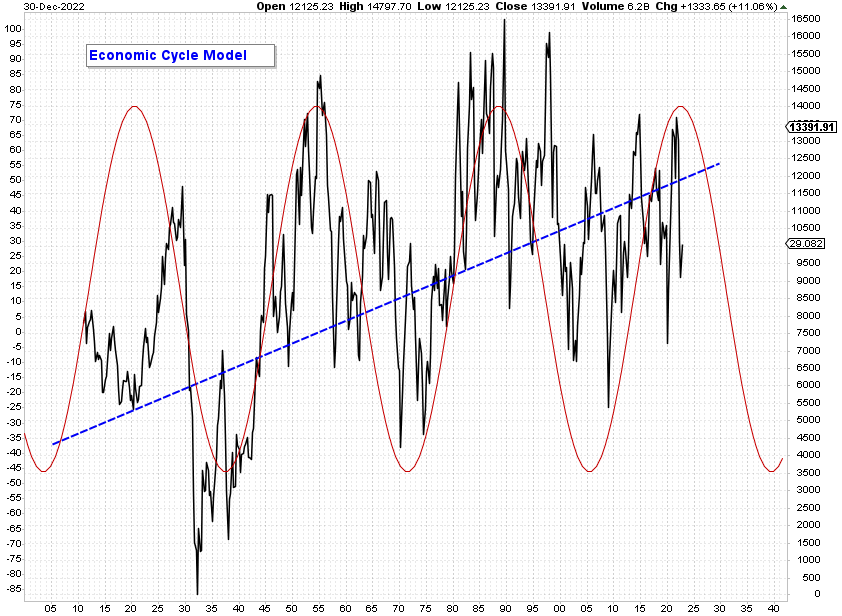
Our cycle wave C target, and ultimately our supercycle wave (IV) target, will be dependent upon the level at which cycle wave B tops, but if the S&P retraces a Fibonacci 78.6% of the 90-year advance off the 1932 low, then we can assume a level of SPX 1030 is not out of the realm of possibilities. The long-term illustrations above should not be interpreted to insinuate any specific timeline. Time does not enter into our Elliott Wave analysis, other to say that corrective waves tend to range between one-quarter and one-half of the time interval of the preceding motive wave at the same degree of trend on average. If the supercycle wave (IV) correction lasts for two decades, or about one-quarter of the 90-year time span of the supercycle wave (III) advance, then we should expect a final low around the year 2042. That is consistent with the next scheduled trough in our long-term Economic Cycle Model above.

There are a number of short-term options that we have been considering, but the best count assumes that the December 22nd intraday low marked the end of minor wave (i) down, of intermediate wave 3 down, and that the market is now tracing out a countertrend advance, which once finished, will mark the the end of minor wave (ii) up, of intermediate wave 3 down. We expect minor wave (ii) to carry to the Fibonacci 38.2% retracement of the minor wave (i) decline, which coincides with a previous fourth wave extreme at one lesser degree of trend. A breach below SPX 3764 would confirm that a third wave decline at three degrees of trend is underway. Conversely, a move above SPX 4100 would suggest that there is still some additional work necessary before intermediate wave 2 up is complete.
Conclusion
There can be no misunderstanding here. Our outlook for the economy, corporate earnings, and the stock market remains grim. As we’ve been advocating for the better part of the last year, during a bear market, it is wise for investors to allocate the majority of their capital (80-90%) to short-term, Treasury securities at the 1-3 year part of the yield curve, where they can now earn up to 4.7% on their money, risk-free. In our view, this investment allocation offers the best combination of safety, liquidity, and income, while the broad equity market continues its decline. We expect the yield on longer duration bonds to work higher over the next 12-18 months. If the 10-year Treasury yield were to exceed 5.0%, then the risk/reward scale would favor rolling-out further on the yield curve, but not yet.
The other 10-20% of an investor’s capital should be held in an interest bearing cash account, ready to be allocated to trading opportunities as they present themselves. Indeed, there are always trading opportunities! For those who have difficulties finding such trading opportunities in a timely manner, or for those who simply have an interest in seeing regular idea flow, our ALPHA INSIGHTS: Idea Generator Lab publication is included with your paid subscription ($15 monthly or $120 annually). The publication highlights our top actionable trade idea each week, and is delivered to your inbox every Wednesday afternoon via email.

Disclaimer
All information and data contained on this site and in reports, analytics, etc. produced by Jeffrey W. Huge (the “author”) is for informational purposes only. The author makes no representations as to accuracy, completeness, suitability, or validity, of any information. The author will not be liable for any errors, omissions, or any losses, injuries, or damages arising from its display or use. All information is provided AS IS with no warranties, and confers no rights.
External links are often provided within the author’s newsletter for the convenience of the reader. The author will not be responsible for any material that is found at the end of these external links.
The author is NOT registered as a securities broker dealer or investment adviser with either the U.S. Securities and Exchange Commission or with any other state or federal securities regulatory authority.
The content of the author’s newsletter should not be considered professional financial investment advice. The ideas and strategies should never be used without first assessing your own personal and financial situation, or without consulting a financial professional. The author may hold positions or other interests in securities mentioned, including positions inconsistent with the views expressed.
The user bears complete responsibility for their own investment research and should seek the advice of a qualified investment professional before making any investment decisions.
Past performance is no guarantee of future results.